Immigrants from Malaysia vs Blackfeet Child Poverty Under the Age of 5
COMPARE
Immigrants from Malaysia
Blackfeet
Child Poverty Under the Age of 5
Child Poverty Under the Age of 5 Comparison
Immigrants from Malaysia
Blackfeet
15.6%
CHILD POVERTY UNDER THE AGE OF 5
97.4/ 100
METRIC RATING
86th/ 347
METRIC RANK
21.8%
CHILD POVERTY UNDER THE AGE OF 5
0.0/ 100
METRIC RATING
298th/ 347
METRIC RANK
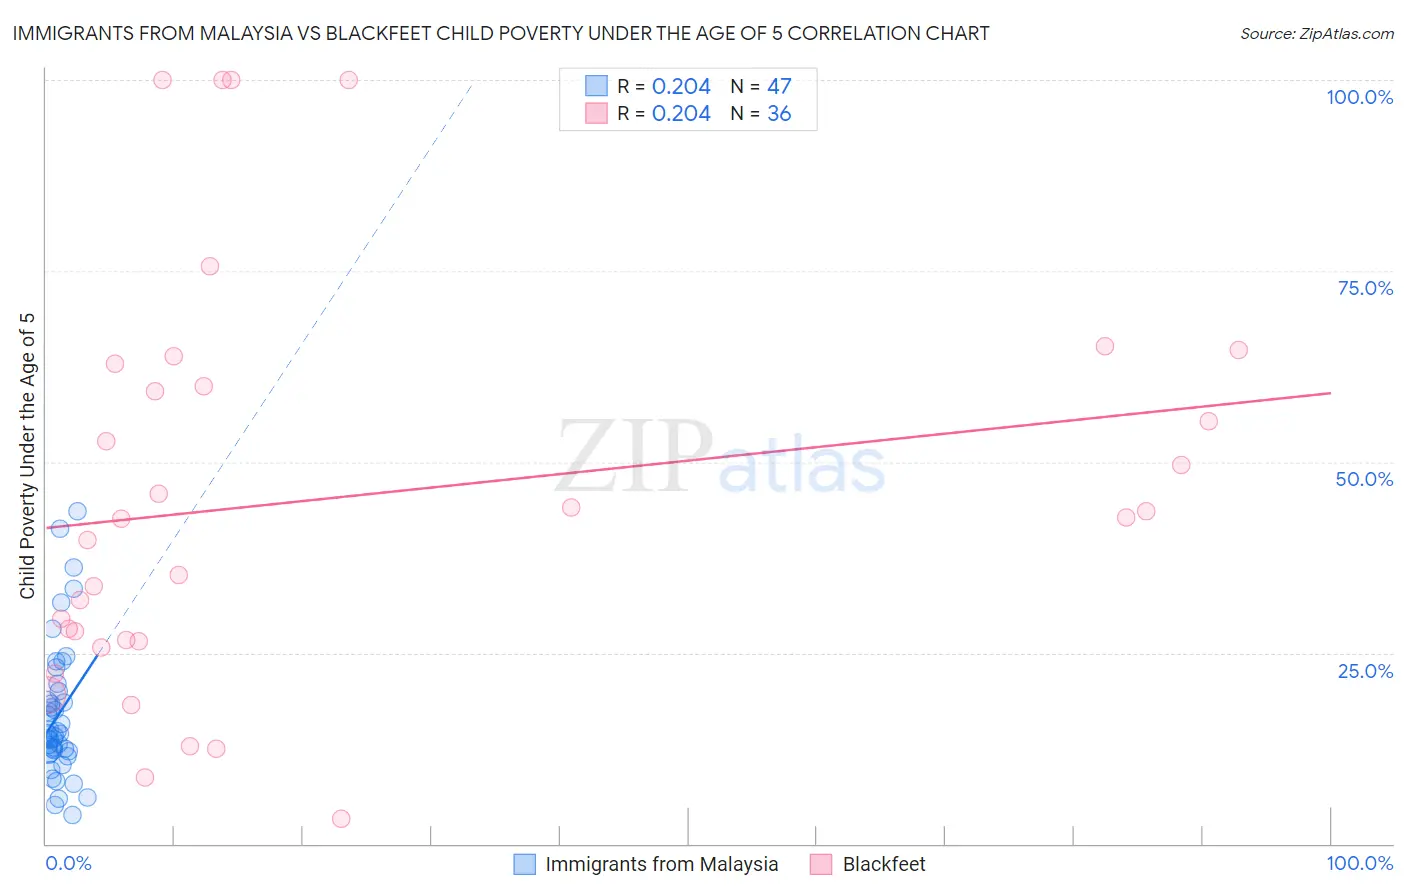
Immigrants from Malaysia vs Blackfeet Child Poverty Under the Age of 5 Correlation Chart
The statistical analysis conducted on geographies consisting of 192,879,817 people shows a weak positive correlation between the proportion of Immigrants from Malaysia and poverty level among children under the age of 5 in the United States with a correlation coefficient (R) of 0.204 and weighted average of 15.6%. Similarly, the statistical analysis conducted on geographies consisting of 302,829,294 people shows a weak positive correlation between the proportion of Blackfeet and poverty level among children under the age of 5 in the United States with a correlation coefficient (R) of 0.204 and weighted average of 21.8%, a difference of 39.8%.
Child Poverty Under the Age of 5 Correlation Summary
| Measurement | Immigrants from Malaysia | Blackfeet |
| Minimum | 3.7% | 3.3% |
| Maximum | 43.6% | 100.0% |
| Range | 39.8% | 96.7% |
| Mean | 16.9% | 45.3% |
| Median | 14.3% | 42.7% |
| Interquartile 25% (IQ1) | 11.8% | 26.7% |
| Interquartile 75% (IQ3) | 20.0% | 61.4% |
| Interquartile Range (IQR) | 8.2% | 34.8% |
| Standard Deviation (Sample) | 8.9% | 26.4% |
| Standard Deviation (Population) | 8.8% | 26.1% |
Similar Demographics by Child Poverty Under the Age of 5
Demographics Similar to Immigrants from Malaysia by Child Poverty Under the Age of 5
In terms of child poverty under the age of 5, the demographic groups most similar to Immigrants from Malaysia are Immigrants from Latvia (15.6%, a difference of 0.0%), Immigrants from Vietnam (15.6%, a difference of 0.080%), Jordanian (15.6%, a difference of 0.13%), Immigrants from Netherlands (15.6%, a difference of 0.16%), and Chilean (15.6%, a difference of 0.18%).
| Demographics | Rating | Rank | Child Poverty Under the Age of 5 |
| Australians | 98.0 /100 | #79 | Exceptional 15.5% |
| Italians | 97.9 /100 | #80 | Exceptional 15.5% |
| Czechs | 97.8 /100 | #81 | Exceptional 15.5% |
| Immigrants | Italy | 97.7 /100 | #82 | Exceptional 15.6% |
| Chileans | 97.6 /100 | #83 | Exceptional 15.6% |
| Immigrants | Netherlands | 97.6 /100 | #84 | Exceptional 15.6% |
| Immigrants | Latvia | 97.4 /100 | #85 | Exceptional 15.6% |
| Immigrants | Malaysia | 97.4 /100 | #86 | Exceptional 15.6% |
| Immigrants | Vietnam | 97.4 /100 | #87 | Exceptional 15.6% |
| Jordanians | 97.3 /100 | #88 | Exceptional 15.6% |
| Immigrants | Croatia | 97.3 /100 | #89 | Exceptional 15.6% |
| Immigrants | France | 97.3 /100 | #90 | Exceptional 15.6% |
| Poles | 97.2 /100 | #91 | Exceptional 15.7% |
| Scandinavians | 97.1 /100 | #92 | Exceptional 15.7% |
| Ukrainians | 97.1 /100 | #93 | Exceptional 15.7% |
Demographics Similar to Blackfeet by Child Poverty Under the Age of 5
In terms of child poverty under the age of 5, the demographic groups most similar to Blackfeet are Chickasaw (21.8%, a difference of 0.0%), Alaskan Athabascan (21.8%, a difference of 0.010%), Hispanic or Latino (21.7%, a difference of 0.39%), Yaqui (21.7%, a difference of 0.40%), and Cherokee (21.7%, a difference of 0.56%).
| Demographics | Rating | Rank | Child Poverty Under the Age of 5 |
| British West Indians | 0.0 /100 | #291 | Tragic 21.4% |
| Immigrants | Somalia | 0.0 /100 | #292 | Tragic 21.6% |
| Mexicans | 0.0 /100 | #293 | Tragic 21.6% |
| Guatemalans | 0.0 /100 | #294 | Tragic 21.6% |
| Cherokee | 0.0 /100 | #295 | Tragic 21.7% |
| Yaqui | 0.0 /100 | #296 | Tragic 21.7% |
| Hispanics or Latinos | 0.0 /100 | #297 | Tragic 21.7% |
| Blackfeet | 0.0 /100 | #298 | Tragic 21.8% |
| Chickasaw | 0.0 /100 | #299 | Tragic 21.8% |
| Alaskan Athabascans | 0.0 /100 | #300 | Tragic 21.8% |
| Immigrants | Central America | 0.0 /100 | #301 | Tragic 22.0% |
| Iroquois | 0.0 /100 | #302 | Tragic 22.0% |
| Inupiat | 0.0 /100 | #303 | Tragic 22.0% |
| Immigrants | Guatemala | 0.0 /100 | #304 | Tragic 22.0% |
| Immigrants | Mexico | 0.0 /100 | #305 | Tragic 22.2% |