Immigrants from Western Asia vs Hmong 8th Grade
COMPARE
Immigrants from Western Asia
Hmong
8th Grade
8th Grade Comparison
Immigrants from Western Asia
Hmong
95.3%
8TH GRADE
6.0/ 100
METRIC RATING
224th/ 347
METRIC RANK
96.1%
8TH GRADE
89.7/ 100
METRIC RATING
139th/ 347
METRIC RANK
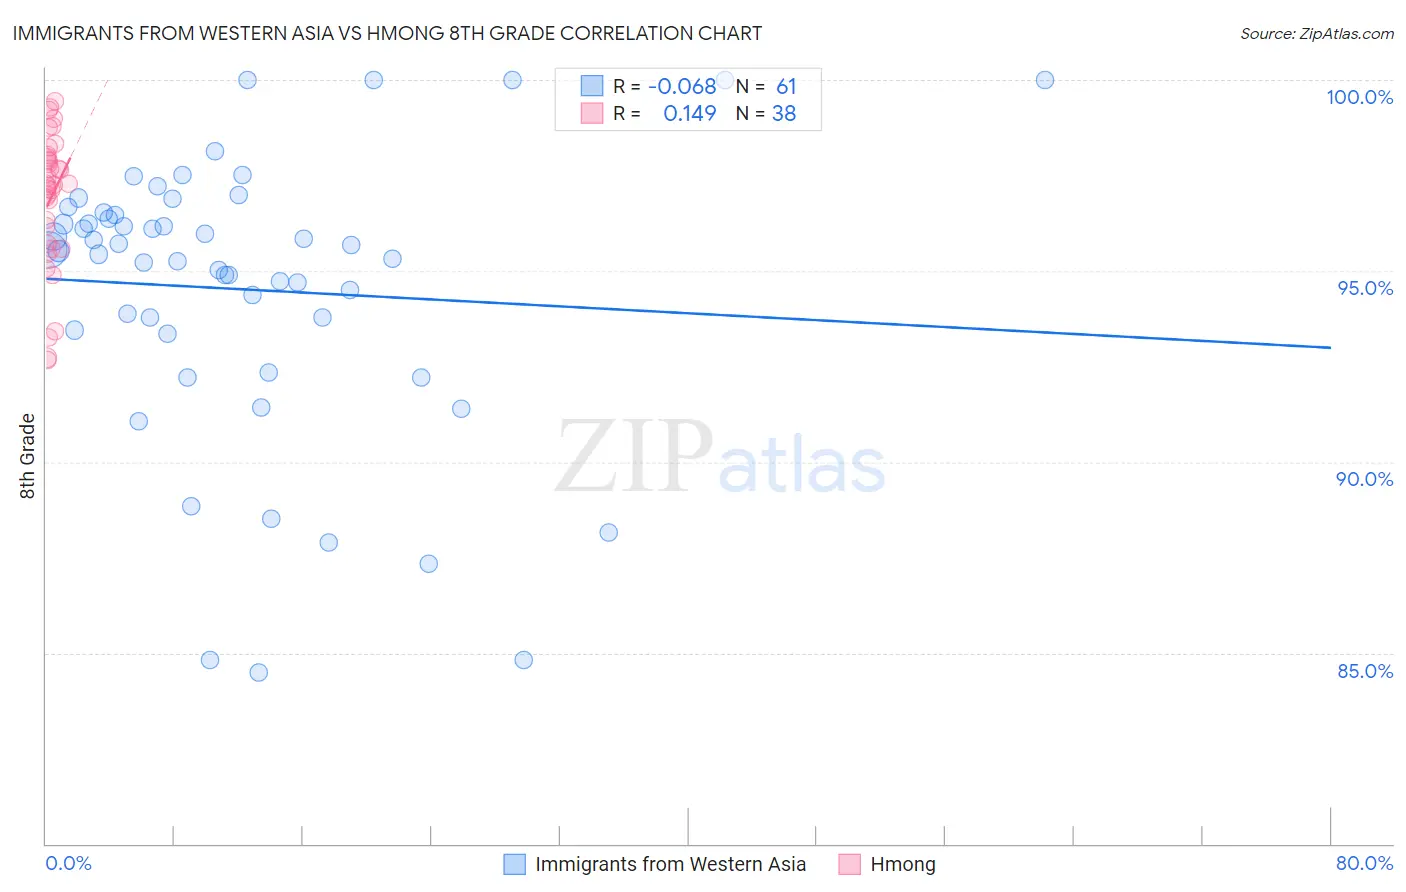
Immigrants from Western Asia vs Hmong 8th Grade Correlation Chart
The statistical analysis conducted on geographies consisting of 404,433,811 people shows a slight negative correlation between the proportion of Immigrants from Western Asia and percentage of population with at least 8th grade education in the United States with a correlation coefficient (R) of -0.068 and weighted average of 95.3%. Similarly, the statistical analysis conducted on geographies consisting of 24,672,093 people shows a poor positive correlation between the proportion of Hmong and percentage of population with at least 8th grade education in the United States with a correlation coefficient (R) of 0.149 and weighted average of 96.1%, a difference of 0.80%.
8th Grade Correlation Summary
| Measurement | Immigrants from Western Asia | Hmong |
| Minimum | 84.5% | 92.7% |
| Maximum | 100.0% | 99.5% |
| Range | 15.5% | 6.8% |
| Mean | 94.5% | 96.9% |
| Median | 95.5% | 97.3% |
| Interquartile 25% (IQ1) | 93.4% | 95.7% |
| Interquartile 75% (IQ3) | 96.5% | 98.0% |
| Interquartile Range (IQR) | 3.1% | 2.2% |
| Standard Deviation (Sample) | 3.7% | 1.8% |
| Standard Deviation (Population) | 3.6% | 1.8% |
Similar Demographics by 8th Grade
Demographics Similar to Immigrants from Western Asia by 8th Grade
In terms of 8th grade, the demographic groups most similar to Immigrants from Western Asia are Subsaharan African (95.3%, a difference of 0.0%), Navajo (95.3%, a difference of 0.010%), Bahamian (95.3%, a difference of 0.010%), Immigrants from Eastern Africa (95.3%, a difference of 0.010%), and Immigrants from Malaysia (95.3%, a difference of 0.030%).
| Demographics | Rating | Rank | 8th Grade |
| Immigrants | Eastern Asia | 8.3 /100 | #217 | Tragic 95.4% |
| Dutch West Indians | 8.1 /100 | #218 | Tragic 95.4% |
| Spanish Americans | 8.0 /100 | #219 | Tragic 95.4% |
| Immigrants | Southern Europe | 7.7 /100 | #220 | Tragic 95.3% |
| Immigrants | Syria | 7.4 /100 | #221 | Tragic 95.3% |
| Immigrants | Malaysia | 7.3 /100 | #222 | Tragic 95.3% |
| Immigrants | Oceania | 7.1 /100 | #223 | Tragic 95.3% |
| Immigrants | Western Asia | 6.0 /100 | #224 | Tragic 95.3% |
| Sub-Saharan Africans | 6.0 /100 | #225 | Tragic 95.3% |
| Navajo | 5.7 /100 | #226 | Tragic 95.3% |
| Bahamians | 5.6 /100 | #227 | Tragic 95.3% |
| Immigrants | Eastern Africa | 5.6 /100 | #228 | Tragic 95.3% |
| Immigrants | Indonesia | 4.4 /100 | #229 | Tragic 95.3% |
| Immigrants | Panama | 4.1 /100 | #230 | Tragic 95.2% |
| Asians | 3.5 /100 | #231 | Tragic 95.2% |
Demographics Similar to Hmong by 8th Grade
In terms of 8th grade, the demographic groups most similar to Hmong are Burmese (96.1%, a difference of 0.010%), Immigrants from South Central Asia (96.1%, a difference of 0.010%), Cambodian (96.1%, a difference of 0.020%), Immigrants from Hungary (96.1%, a difference of 0.030%), and Basque (96.1%, a difference of 0.030%).
| Demographics | Rating | Rank | 8th Grade |
| Immigrants | Kuwait | 92.2 /100 | #132 | Exceptional 96.1% |
| Immigrants | Turkey | 91.7 /100 | #133 | Exceptional 96.1% |
| Immigrants | Hungary | 91.5 /100 | #134 | Exceptional 96.1% |
| Basques | 91.5 /100 | #135 | Exceptional 96.1% |
| Jordanians | 91.3 /100 | #136 | Exceptional 96.1% |
| Cambodians | 90.6 /100 | #137 | Exceptional 96.1% |
| Burmese | 90.2 /100 | #138 | Exceptional 96.1% |
| Hmong | 89.7 /100 | #139 | Excellent 96.1% |
| Immigrants | South Central Asia | 89.4 /100 | #140 | Excellent 96.1% |
| Immigrants | Greece | 85.9 /100 | #141 | Excellent 96.0% |
| Immigrants | Eastern Europe | 85.4 /100 | #142 | Excellent 96.0% |
| Spanish | 85.1 /100 | #143 | Excellent 96.0% |
| Immigrants | Belarus | 84.8 /100 | #144 | Excellent 96.0% |
| Lumbee | 84.1 /100 | #145 | Excellent 96.0% |
| Israelis | 84.1 /100 | #146 | Excellent 96.0% |