Immigrants from Western Asia vs Belgian Single Mother Poverty
COMPARE
Immigrants from Western Asia
Belgian
Single Mother Poverty
Single Mother Poverty Comparison
Immigrants from Western Asia
Belgians
28.3%
SINGLE MOTHER POVERTY
92.7/ 100
METRIC RATING
114th/ 347
METRIC RANK
29.7%
SINGLE MOTHER POVERTY
18.8/ 100
METRIC RATING
201st/ 347
METRIC RANK
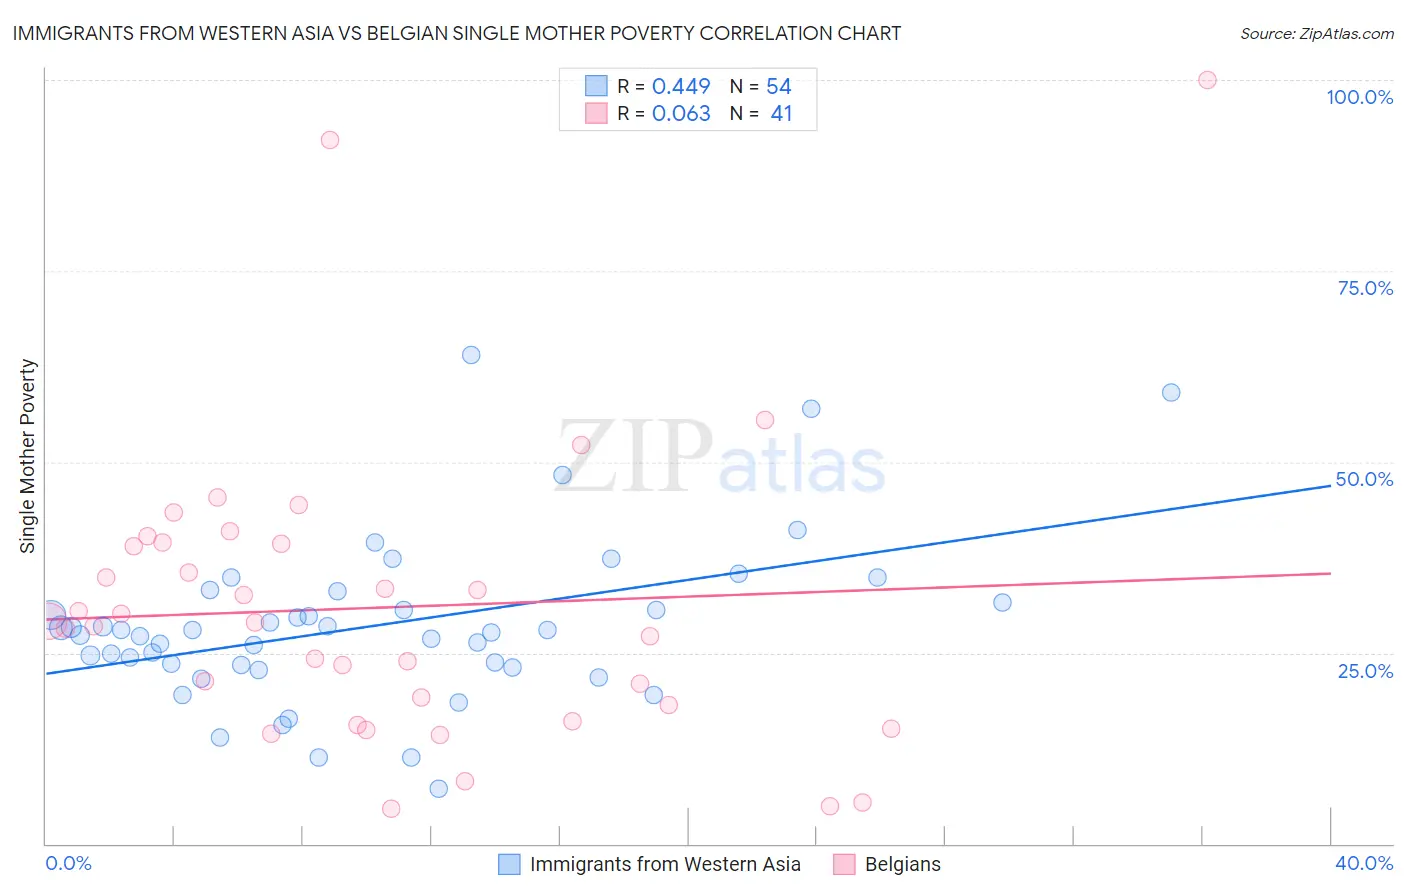
Immigrants from Western Asia vs Belgian Single Mother Poverty Correlation Chart
The statistical analysis conducted on geographies consisting of 393,114,068 people shows a moderate positive correlation between the proportion of Immigrants from Western Asia and poverty level among single mothers in the United States with a correlation coefficient (R) of 0.449 and weighted average of 28.3%. Similarly, the statistical analysis conducted on geographies consisting of 346,546,144 people shows a slight positive correlation between the proportion of Belgians and poverty level among single mothers in the United States with a correlation coefficient (R) of 0.063 and weighted average of 29.7%, a difference of 4.9%.
Single Mother Poverty Correlation Summary
| Measurement | Immigrants from Western Asia | Belgian |
| Minimum | 7.2% | 4.5% |
| Maximum | 63.9% | 100.0% |
| Range | 56.7% | 95.5% |
| Mean | 28.6% | 30.9% |
| Median | 27.8% | 29.0% |
| Interquartile 25% (IQ1) | 23.4% | 17.1% |
| Interquartile 75% (IQ3) | 31.6% | 39.4% |
| Interquartile Range (IQR) | 8.2% | 22.2% |
| Standard Deviation (Sample) | 10.8% | 19.6% |
| Standard Deviation (Population) | 10.7% | 19.3% |
Similar Demographics by Single Mother Poverty
Demographics Similar to Immigrants from Western Asia by Single Mother Poverty
In terms of single mother poverty, the demographic groups most similar to Immigrants from Western Asia are Immigrants from Kuwait (28.3%, a difference of 0.010%), Immigrants from Uganda (28.3%, a difference of 0.030%), Australian (28.3%, a difference of 0.040%), Brazilian (28.3%, a difference of 0.050%), and Immigrants from Syria (28.3%, a difference of 0.060%).
| Demographics | Rating | Rank | Single Mother Poverty |
| Immigrants | Venezuela | 95.8 /100 | #107 | Exceptional 28.1% |
| Immigrants | Zimbabwe | 95.5 /100 | #108 | Exceptional 28.1% |
| Immigrants | Armenia | 95.2 /100 | #109 | Exceptional 28.1% |
| Croatians | 94.8 /100 | #110 | Exceptional 28.2% |
| Venezuelans | 94.5 /100 | #111 | Exceptional 28.2% |
| Immigrants | Kazakhstan | 94.5 /100 | #112 | Exceptional 28.2% |
| Immigrants | South Africa | 93.2 /100 | #113 | Exceptional 28.3% |
| Immigrants | Western Asia | 92.7 /100 | #114 | Exceptional 28.3% |
| Immigrants | Kuwait | 92.7 /100 | #115 | Exceptional 28.3% |
| Immigrants | Uganda | 92.5 /100 | #116 | Exceptional 28.3% |
| Australians | 92.5 /100 | #117 | Exceptional 28.3% |
| Brazilians | 92.4 /100 | #118 | Exceptional 28.3% |
| Immigrants | Syria | 92.4 /100 | #119 | Exceptional 28.3% |
| Cypriots | 92.3 /100 | #120 | Exceptional 28.3% |
| Immigrants | Afghanistan | 92.1 /100 | #121 | Exceptional 28.3% |
Demographics Similar to Belgians by Single Mother Poverty
In terms of single mother poverty, the demographic groups most similar to Belgians are Panamanian (29.6%, a difference of 0.10%), Malaysian (29.7%, a difference of 0.10%), Swiss (29.7%, a difference of 0.12%), Cuban (29.6%, a difference of 0.15%), and Immigrants (29.7%, a difference of 0.18%).
| Demographics | Rating | Rank | Single Mother Poverty |
| Icelanders | 26.1 /100 | #194 | Fair 29.5% |
| Slavs | 24.5 /100 | #195 | Fair 29.6% |
| Spanish American Indians | 23.4 /100 | #196 | Fair 29.6% |
| Immigrants | Jamaica | 22.0 /100 | #197 | Fair 29.6% |
| Trinidadians and Tobagonians | 21.7 /100 | #198 | Fair 29.6% |
| Cubans | 20.8 /100 | #199 | Fair 29.6% |
| Panamanians | 20.0 /100 | #200 | Fair 29.6% |
| Belgians | 18.8 /100 | #201 | Poor 29.7% |
| Malaysians | 17.4 /100 | #202 | Poor 29.7% |
| Swiss | 17.2 /100 | #203 | Poor 29.7% |
| Immigrants | Immigrants | 16.6 /100 | #204 | Poor 29.7% |
| Czechoslovakians | 16.1 /100 | #205 | Poor 29.7% |
| Immigrants | Haiti | 15.8 /100 | #206 | Poor 29.7% |
| Immigrants | Panama | 15.5 /100 | #207 | Poor 29.8% |
| Immigrants | Guyana | 14.7 /100 | #208 | Poor 29.8% |