Immigrants from Bolivia vs Bahamian Male Poverty
COMPARE
Immigrants from Bolivia
Bahamian
Male Poverty
Male Poverty Comparison
Immigrants from Bolivia
Bahamians
9.4%
MALE POVERTY
99.9/ 100
METRIC RATING
12th/ 347
METRIC RANK
14.1%
MALE POVERTY
0.0/ 100
METRIC RATING
303rd/ 347
METRIC RANK
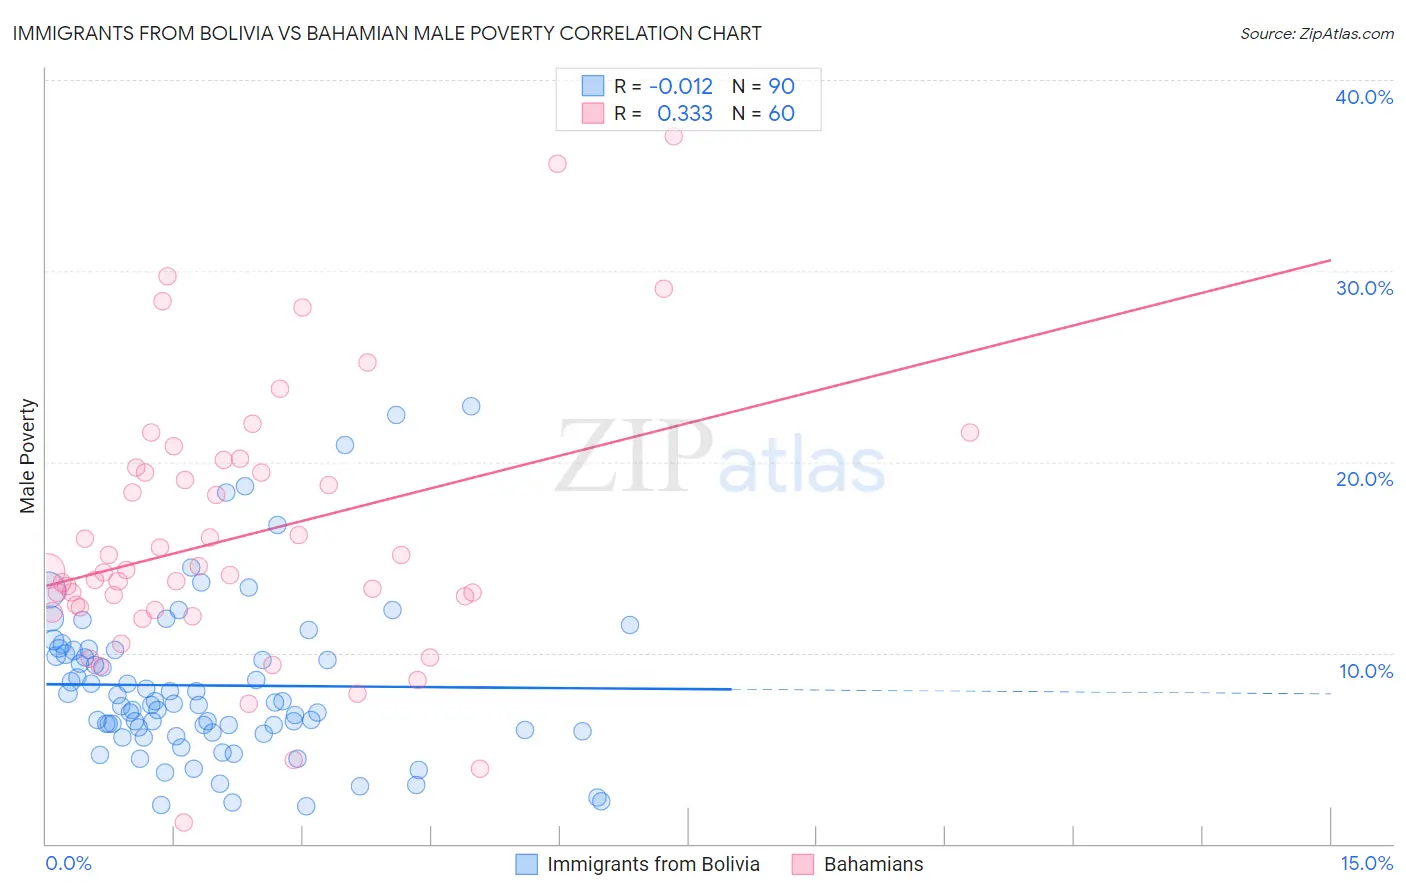
Immigrants from Bolivia vs Bahamian Male Poverty Correlation Chart
The statistical analysis conducted on geographies consisting of 158,688,041 people shows no correlation between the proportion of Immigrants from Bolivia and poverty level among males in the United States with a correlation coefficient (R) of -0.012 and weighted average of 9.4%. Similarly, the statistical analysis conducted on geographies consisting of 112,626,809 people shows a mild positive correlation between the proportion of Bahamians and poverty level among males in the United States with a correlation coefficient (R) of 0.333 and weighted average of 14.1%, a difference of 49.7%.
Male Poverty Correlation Summary
| Measurement | Immigrants from Bolivia | Bahamian |
| Minimum | 2.0% | 1.1% |
| Maximum | 22.9% | 37.0% |
| Range | 20.9% | 35.9% |
| Mean | 8.3% | 16.1% |
| Median | 7.3% | 14.3% |
| Interquartile 25% (IQ1) | 5.9% | 12.3% |
| Interquartile 75% (IQ3) | 10.1% | 19.6% |
| Interquartile Range (IQR) | 4.2% | 7.3% |
| Standard Deviation (Sample) | 4.3% | 7.1% |
| Standard Deviation (Population) | 4.2% | 7.0% |
Similar Demographics by Male Poverty
Demographics Similar to Immigrants from Bolivia by Male Poverty
In terms of male poverty, the demographic groups most similar to Immigrants from Bolivia are Bolivian (9.4%, a difference of 0.050%), Immigrants from Lithuania (9.4%, a difference of 0.12%), Immigrants from North Macedonia (9.4%, a difference of 0.50%), Bulgarian (9.3%, a difference of 0.69%), and Bhutanese (9.5%, a difference of 0.79%).
| Demographics | Rating | Rank | Male Poverty |
| Maltese | 100.0 /100 | #5 | Exceptional 9.1% |
| Assyrians/Chaldeans/Syriacs | 99.9 /100 | #6 | Exceptional 9.1% |
| Immigrants | Ireland | 99.9 /100 | #7 | Exceptional 9.1% |
| Filipinos | 99.9 /100 | #8 | Exceptional 9.2% |
| Immigrants | South Central Asia | 99.9 /100 | #9 | Exceptional 9.3% |
| Bulgarians | 99.9 /100 | #10 | Exceptional 9.3% |
| Bolivians | 99.9 /100 | #11 | Exceptional 9.4% |
| Immigrants | Bolivia | 99.9 /100 | #12 | Exceptional 9.4% |
| Immigrants | Lithuania | 99.9 /100 | #13 | Exceptional 9.4% |
| Immigrants | North Macedonia | 99.8 /100 | #14 | Exceptional 9.4% |
| Bhutanese | 99.8 /100 | #15 | Exceptional 9.5% |
| Luxembourgers | 99.8 /100 | #16 | Exceptional 9.5% |
| Norwegians | 99.8 /100 | #17 | Exceptional 9.5% |
| Lithuanians | 99.8 /100 | #18 | Exceptional 9.5% |
| Immigrants | Hong Kong | 99.7 /100 | #19 | Exceptional 9.6% |
Demographics Similar to Bahamians by Male Poverty
In terms of male poverty, the demographic groups most similar to Bahamians are Immigrants from Caribbean (14.0%, a difference of 0.040%), Immigrants from Senegal (14.0%, a difference of 0.10%), Senegalese (14.1%, a difference of 0.10%), Immigrants from Mexico (14.0%, a difference of 0.17%), and Immigrants from Guatemala (14.0%, a difference of 0.28%).
| Demographics | Rating | Rank | Male Poverty |
| Cajuns | 0.0 /100 | #296 | Tragic 13.9% |
| Inupiat | 0.0 /100 | #297 | Tragic 14.0% |
| Blackfeet | 0.0 /100 | #298 | Tragic 14.0% |
| Immigrants | Guatemala | 0.0 /100 | #299 | Tragic 14.0% |
| Immigrants | Mexico | 0.0 /100 | #300 | Tragic 14.0% |
| Immigrants | Senegal | 0.0 /100 | #301 | Tragic 14.0% |
| Immigrants | Caribbean | 0.0 /100 | #302 | Tragic 14.0% |
| Bahamians | 0.0 /100 | #303 | Tragic 14.1% |
| Senegalese | 0.0 /100 | #304 | Tragic 14.1% |
| Immigrants | Bangladesh | 0.0 /100 | #305 | Tragic 14.1% |
| Creek | 0.0 /100 | #306 | Tragic 14.1% |
| Dutch West Indians | 0.0 /100 | #307 | Tragic 14.2% |
| Africans | 0.0 /100 | #308 | Tragic 14.2% |
| Somalis | 0.0 /100 | #309 | Tragic 14.3% |
| Seminole | 0.0 /100 | #310 | Tragic 14.3% |