Immigrants from Spain vs Immigrants from Bosnia and Herzegovina Poverty
COMPARE
Immigrants from Spain
Immigrants from Bosnia and Herzegovina
Poverty
Poverty Comparison
Immigrants from Spain
Immigrants from Bosnia and Herzegovina
12.3%
POVERTY
51.3/ 100
METRIC RATING
171st/ 347
METRIC RANK
12.0%
POVERTY
73.7/ 100
METRIC RATING
147th/ 347
METRIC RANK
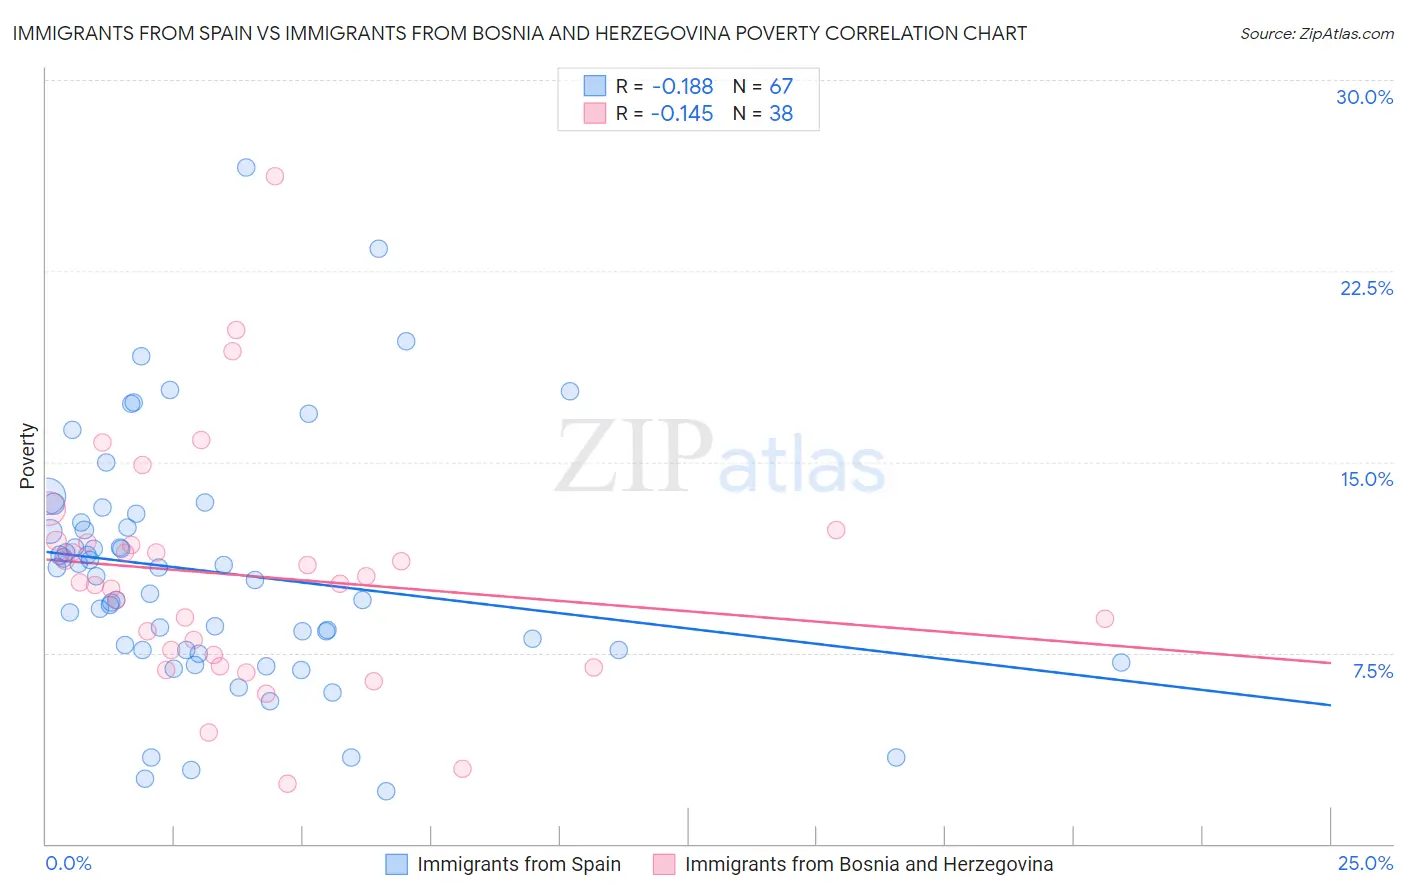
Immigrants from Spain vs Immigrants from Bosnia and Herzegovina Poverty Correlation Chart
The statistical analysis conducted on geographies consisting of 239,619,793 people shows a poor negative correlation between the proportion of Immigrants from Spain and poverty level in the United States with a correlation coefficient (R) of -0.188 and weighted average of 12.3%. Similarly, the statistical analysis conducted on geographies consisting of 156,765,120 people shows a poor negative correlation between the proportion of Immigrants from Bosnia and Herzegovina and poverty level in the United States with a correlation coefficient (R) of -0.145 and weighted average of 12.0%, a difference of 2.4%.
Poverty Correlation Summary
| Measurement | Immigrants from Spain | Immigrants from Bosnia and Herzegovina |
| Minimum | 2.1% | 2.3% |
| Maximum | 26.5% | 26.2% |
| Range | 24.5% | 23.9% |
| Mean | 10.7% | 10.5% |
| Median | 10.5% | 10.2% |
| Interquartile 25% (IQ1) | 7.6% | 7.4% |
| Interquartile 75% (IQ3) | 12.6% | 11.8% |
| Interquartile Range (IQR) | 5.0% | 4.4% |
| Standard Deviation (Sample) | 4.7% | 4.7% |
| Standard Deviation (Population) | 4.7% | 4.6% |
Similar Demographics by Poverty
Demographics Similar to Immigrants from Spain by Poverty
In terms of poverty, the demographic groups most similar to Immigrants from Spain are Immigrants from Portugal (12.3%, a difference of 0.070%), Celtic (12.3%, a difference of 0.11%), Lebanese (12.3%, a difference of 0.12%), South American (12.3%, a difference of 0.25%), and Immigrants from Oceania (12.3%, a difference of 0.32%).
| Demographics | Rating | Rank | Poverty |
| Colombians | 57.8 /100 | #164 | Average 12.2% |
| Immigrants | Albania | 57.7 /100 | #165 | Average 12.2% |
| Venezuelans | 56.9 /100 | #166 | Average 12.2% |
| Immigrants | Chile | 56.7 /100 | #167 | Average 12.2% |
| Immigrants | Venezuela | 56.5 /100 | #168 | Average 12.2% |
| Whites/Caucasians | 55.4 /100 | #169 | Average 12.3% |
| Immigrants | Oceania | 54.6 /100 | #170 | Average 12.3% |
| Immigrants | Spain | 51.3 /100 | #171 | Average 12.3% |
| Immigrants | Portugal | 50.5 /100 | #172 | Average 12.3% |
| Celtics | 50.1 /100 | #173 | Average 12.3% |
| Lebanese | 50.0 /100 | #174 | Average 12.3% |
| South Americans | 48.7 /100 | #175 | Average 12.3% |
| Immigrants | Colombia | 47.7 /100 | #176 | Average 12.3% |
| Immigrants | Syria | 47.5 /100 | #177 | Average 12.3% |
| Uruguayans | 44.7 /100 | #178 | Average 12.4% |
Demographics Similar to Immigrants from Bosnia and Herzegovina by Poverty
In terms of poverty, the demographic groups most similar to Immigrants from Bosnia and Herzegovina are Immigrants from Germany (12.0%, a difference of 0.12%), Immigrants from Malaysia (12.0%, a difference of 0.12%), Afghan (12.0%, a difference of 0.16%), Immigrants from Kazakhstan (12.0%, a difference of 0.17%), and Syrian (12.0%, a difference of 0.19%).
| Demographics | Rating | Rank | Poverty |
| Immigrants | Peru | 81.1 /100 | #140 | Excellent 11.9% |
| Immigrants | France | 80.5 /100 | #141 | Excellent 11.9% |
| Basques | 80.4 /100 | #142 | Excellent 11.9% |
| Brazilians | 79.7 /100 | #143 | Good 11.9% |
| Icelanders | 77.9 /100 | #144 | Good 11.9% |
| Syrians | 75.1 /100 | #145 | Good 12.0% |
| Afghans | 74.9 /100 | #146 | Good 12.0% |
| Immigrants | Bosnia and Herzegovina | 73.7 /100 | #147 | Good 12.0% |
| Immigrants | Germany | 72.7 /100 | #148 | Good 12.0% |
| Immigrants | Malaysia | 72.7 /100 | #149 | Good 12.0% |
| Immigrants | Kazakhstan | 72.3 /100 | #150 | Good 12.0% |
| Samoans | 71.9 /100 | #151 | Good 12.0% |
| Armenians | 67.6 /100 | #152 | Good 12.1% |
| Immigrants | Northern Africa | 63.9 /100 | #153 | Good 12.1% |
| Guamanians/Chamorros | 63.9 /100 | #154 | Good 12.1% |