Immigrants from Trinidad and Tobago vs Immigrants from Bosnia and Herzegovina Births to Unmarried Women
COMPARE
Immigrants from Trinidad and Tobago
Immigrants from Bosnia and Herzegovina
Births to Unmarried Women
Births to Unmarried Women Comparison
Immigrants from Trinidad and Tobago
Immigrants from Bosnia and Herzegovina
36.3%
BIRTHS TO UNMARRIED WOMEN
0.2/ 100
METRIC RATING
256th/ 347
METRIC RANK
30.3%
BIRTHS TO UNMARRIED WOMEN
85.7/ 100
METRIC RATING
130th/ 347
METRIC RANK
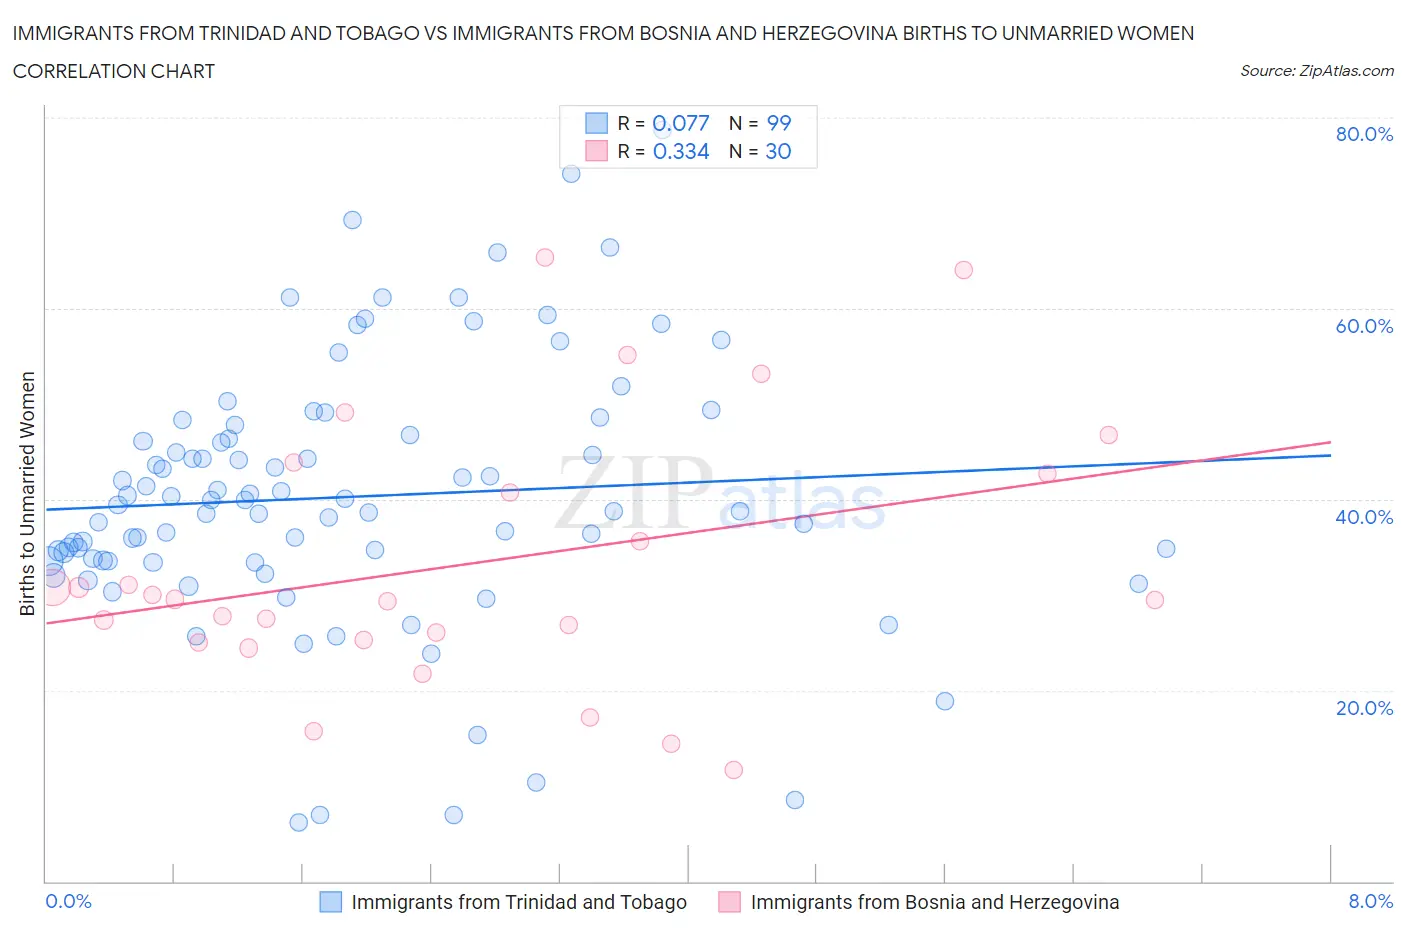
Immigrants from Trinidad and Tobago vs Immigrants from Bosnia and Herzegovina Births to Unmarried Women Correlation Chart
The statistical analysis conducted on geographies consisting of 215,338,343 people shows a slight positive correlation between the proportion of Immigrants from Trinidad and Tobago and percentage of births to unmarried women in the United States with a correlation coefficient (R) of 0.077 and weighted average of 36.3%. Similarly, the statistical analysis conducted on geographies consisting of 151,670,112 people shows a mild positive correlation between the proportion of Immigrants from Bosnia and Herzegovina and percentage of births to unmarried women in the United States with a correlation coefficient (R) of 0.334 and weighted average of 30.3%, a difference of 19.7%.
Births to Unmarried Women Correlation Summary
| Measurement | Immigrants from Trinidad and Tobago | Immigrants from Bosnia and Herzegovina |
| Minimum | 6.1% | 11.7% |
| Maximum | 78.7% | 65.3% |
| Range | 72.6% | 53.6% |
| Mean | 40.3% | 33.3% |
| Median | 39.5% | 29.5% |
| Interquartile 25% (IQ1) | 33.6% | 25.3% |
| Interquartile 75% (IQ3) | 46.8% | 42.7% |
| Interquartile Range (IQR) | 13.2% | 17.4% |
| Standard Deviation (Sample) | 13.7% | 13.8% |
| Standard Deviation (Population) | 13.7% | 13.6% |
Similar Demographics by Births to Unmarried Women
Demographics Similar to Immigrants from Trinidad and Tobago by Births to Unmarried Women
In terms of births to unmarried women, the demographic groups most similar to Immigrants from Trinidad and Tobago are Chickasaw (36.3%, a difference of 0.0%), Immigrants from Grenada (36.3%, a difference of 0.030%), Potawatomi (36.2%, a difference of 0.14%), American (36.4%, a difference of 0.31%), and Immigrants from Portugal (36.2%, a difference of 0.36%).
| Demographics | Rating | Rank | Births to Unmarried Women |
| Bermudans | 0.6 /100 | #249 | Tragic 35.5% |
| Mexican American Indians | 0.4 /100 | #250 | Tragic 35.7% |
| Immigrants | Western Africa | 0.3 /100 | #251 | Tragic 36.0% |
| Salvadorans | 0.3 /100 | #252 | Tragic 36.0% |
| Immigrants | Portugal | 0.2 /100 | #253 | Tragic 36.2% |
| Potawatomi | 0.2 /100 | #254 | Tragic 36.2% |
| Chickasaw | 0.2 /100 | #255 | Tragic 36.3% |
| Immigrants | Trinidad and Tobago | 0.2 /100 | #256 | Tragic 36.3% |
| Immigrants | Grenada | 0.2 /100 | #257 | Tragic 36.3% |
| Americans | 0.2 /100 | #258 | Tragic 36.4% |
| Immigrants | El Salvador | 0.2 /100 | #259 | Tragic 36.4% |
| Ottawa | 0.2 /100 | #260 | Tragic 36.5% |
| Trinidadians and Tobagonians | 0.2 /100 | #261 | Tragic 36.5% |
| French American Indians | 0.1 /100 | #262 | Tragic 36.6% |
| Nicaraguans | 0.1 /100 | #263 | Tragic 36.6% |
Demographics Similar to Immigrants from Bosnia and Herzegovina by Births to Unmarried Women
In terms of births to unmarried women, the demographic groups most similar to Immigrants from Bosnia and Herzegovina are Immigrants from Spain (30.3%, a difference of 0.010%), Immigrants from Zimbabwe (30.3%, a difference of 0.010%), Icelander (30.3%, a difference of 0.050%), New Zealander (30.3%, a difference of 0.050%), and Immigrants from Morocco (30.4%, a difference of 0.090%).
| Demographics | Rating | Rank | Births to Unmarried Women |
| Syrians | 88.2 /100 | #123 | Excellent 30.2% |
| Croatians | 88.0 /100 | #124 | Excellent 30.2% |
| Vietnamese | 87.7 /100 | #125 | Excellent 30.2% |
| Europeans | 87.2 /100 | #126 | Excellent 30.2% |
| Chinese | 87.1 /100 | #127 | Excellent 30.2% |
| Icelanders | 86.0 /100 | #128 | Excellent 30.3% |
| Immigrants | Spain | 85.8 /100 | #129 | Excellent 30.3% |
| Immigrants | Bosnia and Herzegovina | 85.7 /100 | #130 | Excellent 30.3% |
| Immigrants | Zimbabwe | 85.7 /100 | #131 | Excellent 30.3% |
| New Zealanders | 85.5 /100 | #132 | Excellent 30.3% |
| Immigrants | Morocco | 85.2 /100 | #133 | Excellent 30.4% |
| Immigrants | South Eastern Asia | 85.2 /100 | #134 | Excellent 30.4% |
| Brazilians | 84.8 /100 | #135 | Excellent 30.4% |
| Immigrants | Scotland | 84.6 /100 | #136 | Excellent 30.4% |
| Immigrants | Philippines | 83.9 /100 | #137 | Excellent 30.4% |