Central American Indian vs Immigrants from Bosnia and Herzegovina Poverty
COMPARE
Central American Indian
Immigrants from Bosnia and Herzegovina
Poverty
Poverty Comparison
Central American Indians
Immigrants from Bosnia and Herzegovina
16.7%
POVERTY
0.0/ 100
METRIC RATING
325th/ 347
METRIC RANK
12.0%
POVERTY
73.7/ 100
METRIC RATING
147th/ 347
METRIC RANK
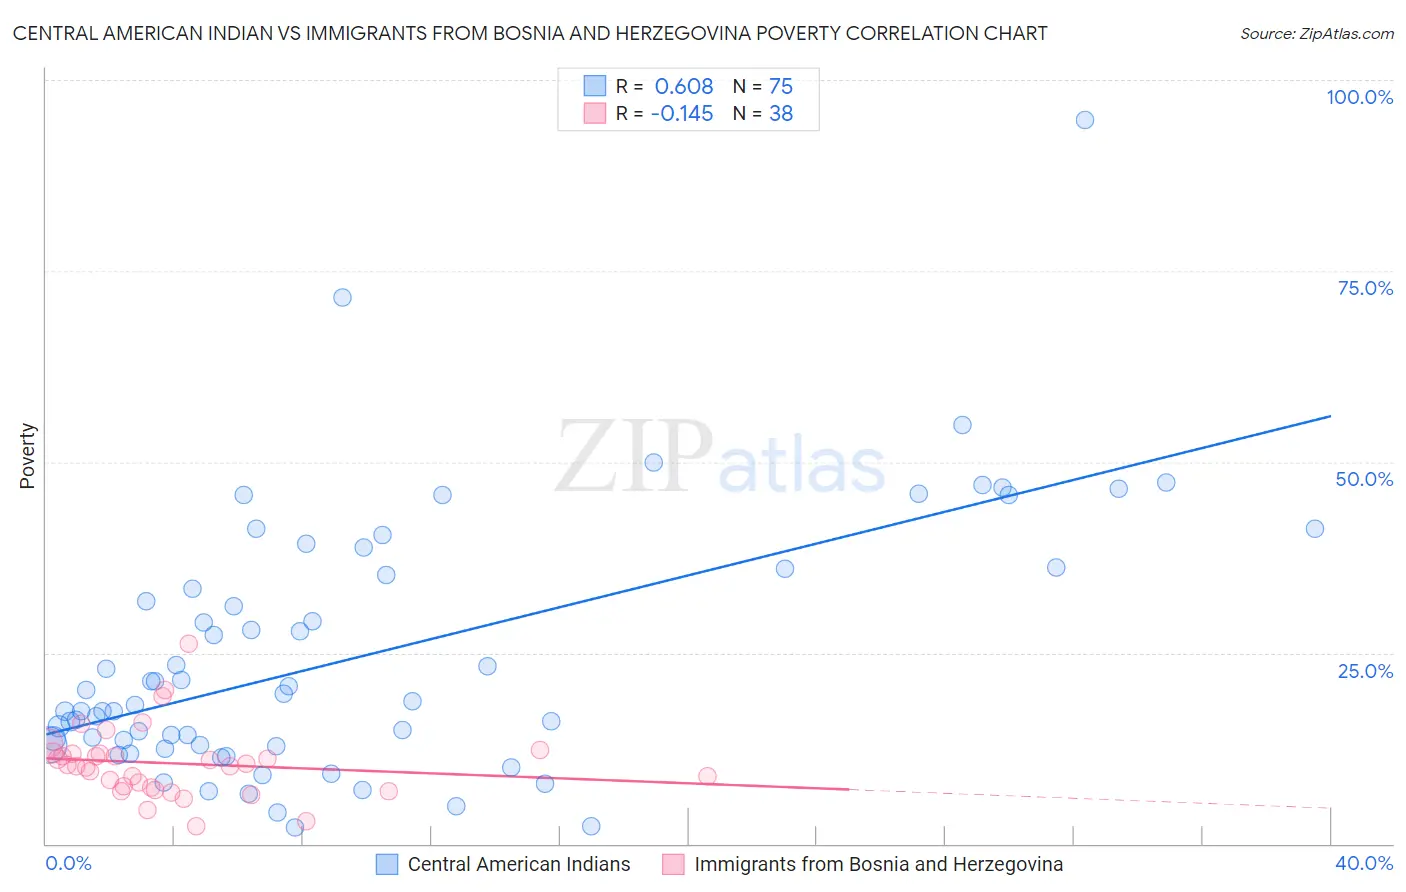
Central American Indian vs Immigrants from Bosnia and Herzegovina Poverty Correlation Chart
The statistical analysis conducted on geographies consisting of 326,078,193 people shows a significant positive correlation between the proportion of Central American Indians and poverty level in the United States with a correlation coefficient (R) of 0.608 and weighted average of 16.7%. Similarly, the statistical analysis conducted on geographies consisting of 156,765,120 people shows a poor negative correlation between the proportion of Immigrants from Bosnia and Herzegovina and poverty level in the United States with a correlation coefficient (R) of -0.145 and weighted average of 12.0%, a difference of 39.0%.
Poverty Correlation Summary
| Measurement | Central American Indian | Immigrants from Bosnia and Herzegovina |
| Minimum | 2.1% | 2.3% |
| Maximum | 94.8% | 26.2% |
| Range | 92.7% | 23.9% |
| Mean | 24.6% | 10.5% |
| Median | 18.6% | 10.2% |
| Interquartile 25% (IQ1) | 12.9% | 7.4% |
| Interquartile 75% (IQ3) | 36.0% | 11.8% |
| Interquartile Range (IQR) | 23.1% | 4.4% |
| Standard Deviation (Sample) | 16.9% | 4.7% |
| Standard Deviation (Population) | 16.8% | 4.6% |
Similar Demographics by Poverty
Demographics Similar to Central American Indians by Poverty
In terms of poverty, the demographic groups most similar to Central American Indians are Yakama (16.7%, a difference of 0.23%), Paiute (16.7%, a difference of 0.29%), Colville (16.6%, a difference of 0.77%), Kiowa (16.8%, a difference of 0.82%), and Ute (16.9%, a difference of 1.3%).
| Demographics | Rating | Rank | Poverty |
| Immigrants | Dominica | 0.0 /100 | #318 | Tragic 16.1% |
| Immigrants | Congo | 0.0 /100 | #319 | Tragic 16.1% |
| Immigrants | Honduras | 0.0 /100 | #320 | Tragic 16.2% |
| Arapaho | 0.0 /100 | #321 | Tragic 16.3% |
| Menominee | 0.0 /100 | #322 | Tragic 16.4% |
| Colville | 0.0 /100 | #323 | Tragic 16.6% |
| Yakama | 0.0 /100 | #324 | Tragic 16.7% |
| Central American Indians | 0.0 /100 | #325 | Tragic 16.7% |
| Paiute | 0.0 /100 | #326 | Tragic 16.7% |
| Kiowa | 0.0 /100 | #327 | Tragic 16.8% |
| Ute | 0.0 /100 | #328 | Tragic 16.9% |
| Blacks/African Americans | 0.0 /100 | #329 | Tragic 17.3% |
| Dominicans | 0.0 /100 | #330 | Tragic 17.6% |
| Immigrants | Dominican Republic | 0.0 /100 | #331 | Tragic 17.8% |
| Natives/Alaskans | 0.0 /100 | #332 | Tragic 18.1% |
Demographics Similar to Immigrants from Bosnia and Herzegovina by Poverty
In terms of poverty, the demographic groups most similar to Immigrants from Bosnia and Herzegovina are Immigrants from Germany (12.0%, a difference of 0.12%), Immigrants from Malaysia (12.0%, a difference of 0.12%), Afghan (12.0%, a difference of 0.16%), Immigrants from Kazakhstan (12.0%, a difference of 0.17%), and Syrian (12.0%, a difference of 0.19%).
| Demographics | Rating | Rank | Poverty |
| Immigrants | Peru | 81.1 /100 | #140 | Excellent 11.9% |
| Immigrants | France | 80.5 /100 | #141 | Excellent 11.9% |
| Basques | 80.4 /100 | #142 | Excellent 11.9% |
| Brazilians | 79.7 /100 | #143 | Good 11.9% |
| Icelanders | 77.9 /100 | #144 | Good 11.9% |
| Syrians | 75.1 /100 | #145 | Good 12.0% |
| Afghans | 74.9 /100 | #146 | Good 12.0% |
| Immigrants | Bosnia and Herzegovina | 73.7 /100 | #147 | Good 12.0% |
| Immigrants | Germany | 72.7 /100 | #148 | Good 12.0% |
| Immigrants | Malaysia | 72.7 /100 | #149 | Good 12.0% |
| Immigrants | Kazakhstan | 72.3 /100 | #150 | Good 12.0% |
| Samoans | 71.9 /100 | #151 | Good 12.0% |
| Armenians | 67.6 /100 | #152 | Good 12.1% |
| Immigrants | Northern Africa | 63.9 /100 | #153 | Good 12.1% |
| Guamanians/Chamorros | 63.9 /100 | #154 | Good 12.1% |