Immigrants from Kenya vs Immigrants from the Azores Child Poverty Under the Age of 5
COMPARE
Immigrants from Kenya
Immigrants from the Azores
Child Poverty Under the Age of 5
Child Poverty Under the Age of 5 Comparison
Immigrants from Kenya
Immigrants from the Azores
17.9%
CHILD POVERTY UNDER THE AGE OF 5
20.0/ 100
METRIC RATING
197th/ 347
METRIC RANK
18.9%
CHILD POVERTY UNDER THE AGE OF 5
2.6/ 100
METRIC RATING
220th/ 347
METRIC RANK
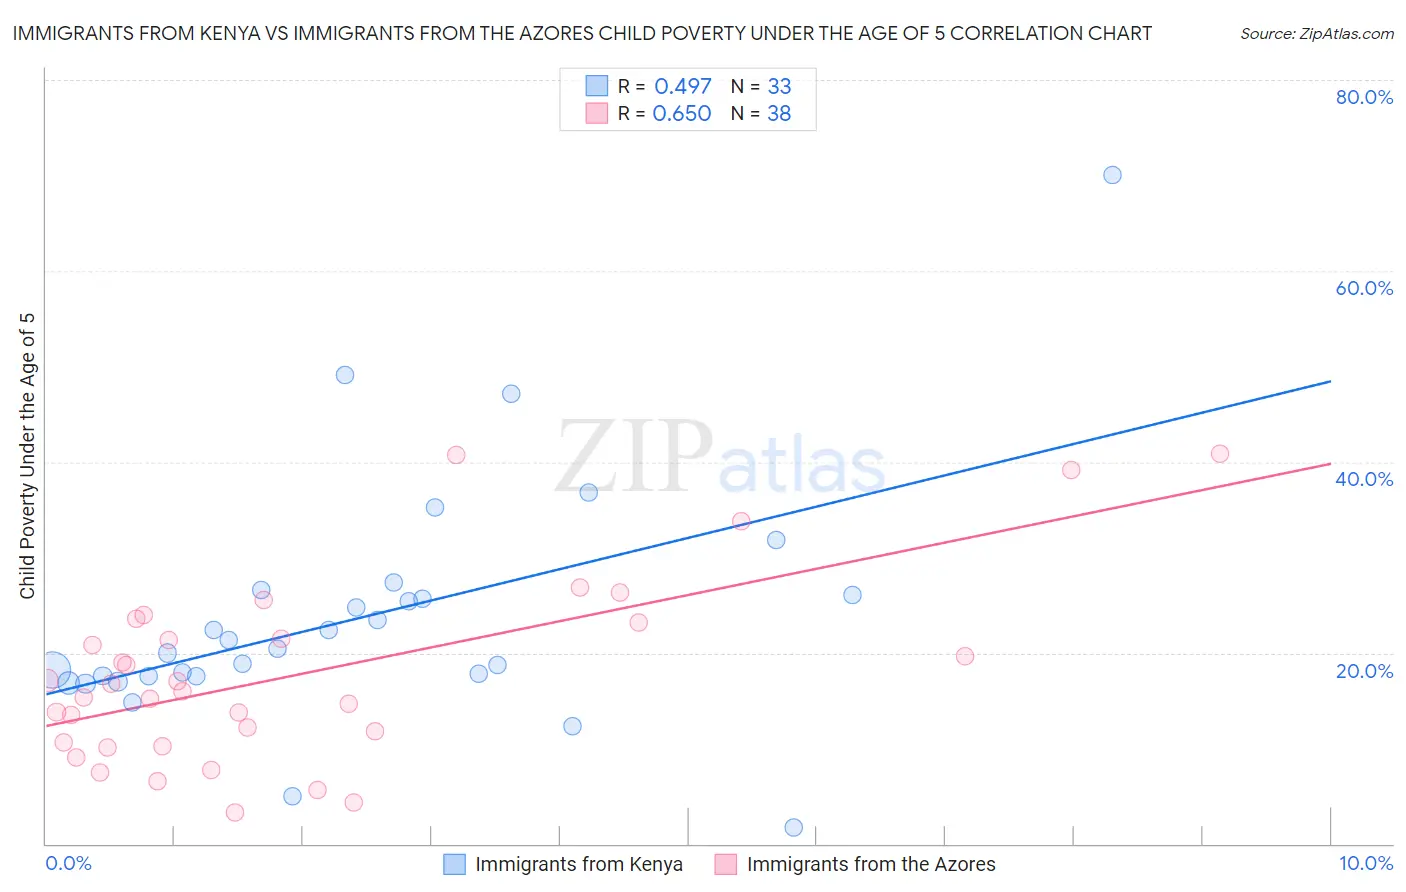
Immigrants from Kenya vs Immigrants from the Azores Child Poverty Under the Age of 5 Correlation Chart
The statistical analysis conducted on geographies consisting of 213,748,262 people shows a moderate positive correlation between the proportion of Immigrants from Kenya and poverty level among children under the age of 5 in the United States with a correlation coefficient (R) of 0.497 and weighted average of 17.9%. Similarly, the statistical analysis conducted on geographies consisting of 45,317,352 people shows a significant positive correlation between the proportion of Immigrants from the Azores and poverty level among children under the age of 5 in the United States with a correlation coefficient (R) of 0.650 and weighted average of 18.9%, a difference of 5.6%.
Child Poverty Under the Age of 5 Correlation Summary
| Measurement | Immigrants from Kenya | Immigrants from the Azores |
| Minimum | 1.7% | 3.3% |
| Maximum | 70.0% | 40.8% |
| Range | 68.3% | 37.5% |
| Mean | 23.8% | 17.8% |
| Median | 20.4% | 16.4% |
| Interquartile 25% (IQ1) | 17.5% | 10.6% |
| Interquartile 75% (IQ3) | 26.3% | 23.2% |
| Interquartile Range (IQR) | 8.8% | 12.6% |
| Standard Deviation (Sample) | 12.8% | 9.6% |
| Standard Deviation (Population) | 12.6% | 9.4% |
Similar Demographics by Child Poverty Under the Age of 5
Demographics Similar to Immigrants from Kenya by Child Poverty Under the Age of 5
In terms of child poverty under the age of 5, the demographic groups most similar to Immigrants from Kenya are Celtic (17.9%, a difference of 0.28%), Hungarian (17.9%, a difference of 0.28%), Immigrants from Portugal (17.8%, a difference of 0.33%), Sierra Leonean (17.7%, a difference of 0.60%), and French Canadian (17.7%, a difference of 0.67%).
| Demographics | Rating | Rank | Child Poverty Under the Age of 5 |
| Slovaks | 29.2 /100 | #190 | Fair 17.6% |
| Immigrants | Afghanistan | 27.9 /100 | #191 | Fair 17.7% |
| Immigrants | Uruguay | 27.8 /100 | #192 | Fair 17.7% |
| Immigrants | Uganda | 25.0 /100 | #193 | Fair 17.7% |
| French Canadians | 24.6 /100 | #194 | Fair 17.7% |
| Sierra Leoneans | 24.1 /100 | #195 | Fair 17.7% |
| Immigrants | Portugal | 22.2 /100 | #196 | Fair 17.8% |
| Immigrants | Kenya | 20.0 /100 | #197 | Fair 17.9% |
| Celtics | 18.3 /100 | #198 | Poor 17.9% |
| Hungarians | 18.3 /100 | #199 | Poor 17.9% |
| Iraqis | 14.0 /100 | #200 | Poor 18.0% |
| Ugandans | 13.9 /100 | #201 | Poor 18.0% |
| Japanese | 13.8 /100 | #202 | Poor 18.1% |
| Immigrants | Cambodia | 13.7 /100 | #203 | Poor 18.1% |
| Immigrants | Eastern Africa | 13.4 /100 | #204 | Poor 18.1% |
Demographics Similar to Immigrants from the Azores by Child Poverty Under the Age of 5
In terms of child poverty under the age of 5, the demographic groups most similar to Immigrants from the Azores are German Russian (18.8%, a difference of 0.36%), Immigrants from Nigeria (19.0%, a difference of 0.56%), Delaware (18.7%, a difference of 0.67%), Alsatian (19.1%, a difference of 1.1%), and Cuban (19.1%, a difference of 1.1%).
| Demographics | Rating | Rank | Child Poverty Under the Age of 5 |
| Immigrants | Thailand | 8.6 /100 | #213 | Tragic 18.3% |
| Malaysians | 6.5 /100 | #214 | Tragic 18.4% |
| Immigrants | Panama | 6.0 /100 | #215 | Tragic 18.5% |
| Hmong | 5.0 /100 | #216 | Tragic 18.5% |
| Immigrants | Africa | 4.6 /100 | #217 | Tragic 18.6% |
| Delaware | 3.4 /100 | #218 | Tragic 18.7% |
| German Russians | 3.0 /100 | #219 | Tragic 18.8% |
| Immigrants | Azores | 2.6 /100 | #220 | Tragic 18.9% |
| Immigrants | Nigeria | 2.1 /100 | #221 | Tragic 19.0% |
| Alsatians | 1.7 /100 | #222 | Tragic 19.1% |
| Cubans | 1.7 /100 | #223 | Tragic 19.1% |
| Nicaraguans | 1.6 /100 | #224 | Tragic 19.1% |
| Nigerians | 1.6 /100 | #225 | Tragic 19.1% |
| Immigrants | Eritrea | 1.5 /100 | #226 | Tragic 19.1% |
| Cape Verdeans | 1.4 /100 | #227 | Tragic 19.1% |