African vs Immigrants from the Azores Child Poverty Under the Age of 5
COMPARE
African
Immigrants from the Azores
Child Poverty Under the Age of 5
Child Poverty Under the Age of 5 Comparison
Africans
Immigrants from the Azores
22.8%
CHILD POVERTY UNDER THE AGE OF 5
0.0/ 100
METRIC RATING
310th/ 347
METRIC RANK
18.9%
CHILD POVERTY UNDER THE AGE OF 5
2.6/ 100
METRIC RATING
220th/ 347
METRIC RANK
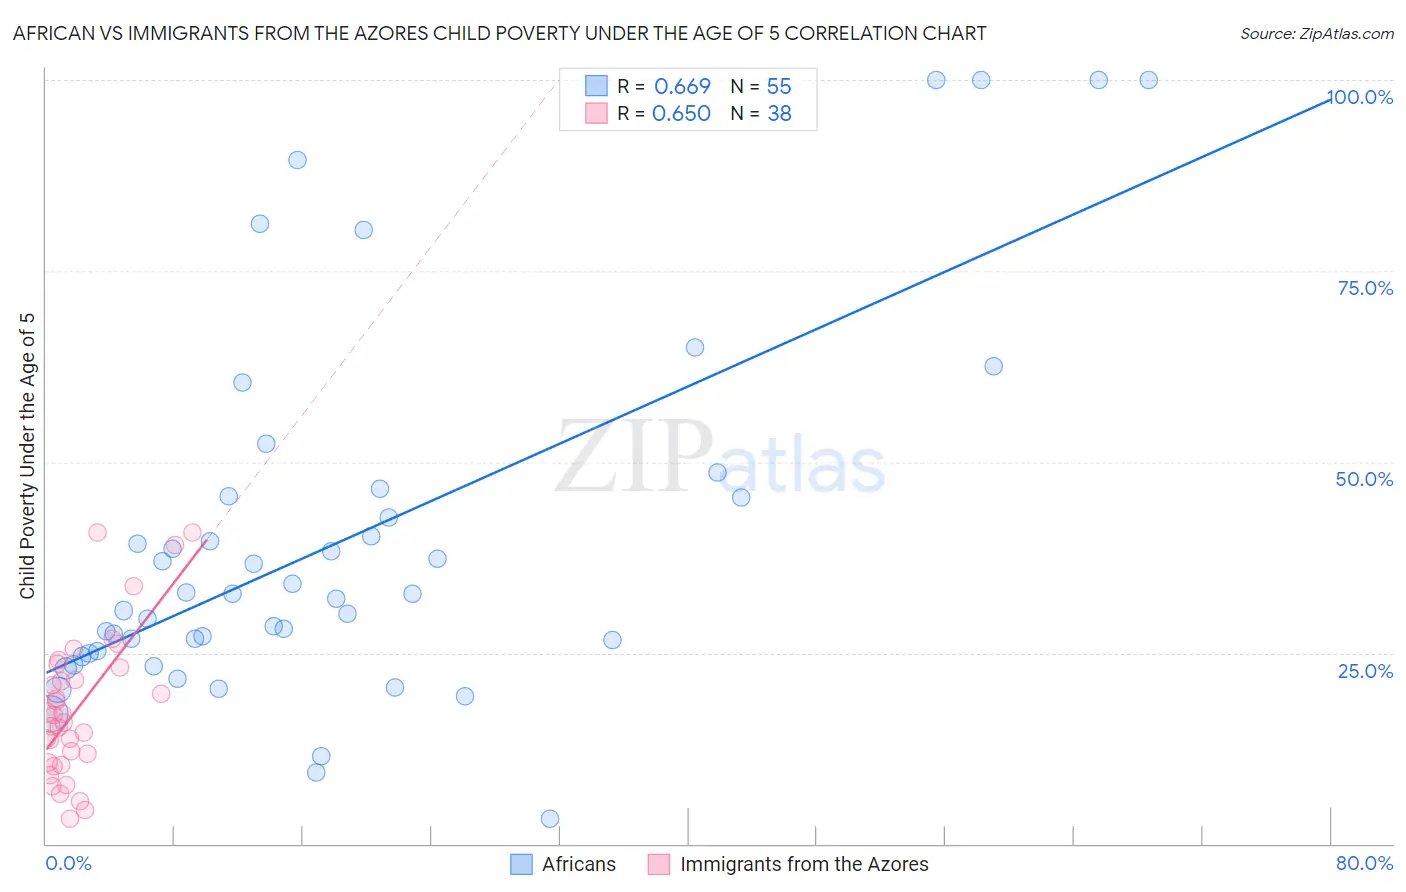
African vs Immigrants from the Azores Child Poverty Under the Age of 5 Correlation Chart
The statistical analysis conducted on geographies consisting of 453,839,737 people shows a significant positive correlation between the proportion of Africans and poverty level among children under the age of 5 in the United States with a correlation coefficient (R) of 0.669 and weighted average of 22.8%. Similarly, the statistical analysis conducted on geographies consisting of 45,317,352 people shows a significant positive correlation between the proportion of Immigrants from the Azores and poverty level among children under the age of 5 in the United States with a correlation coefficient (R) of 0.650 and weighted average of 18.9%, a difference of 21.0%.
Child Poverty Under the Age of 5 Correlation Summary
| Measurement | African | Immigrants from the Azores |
| Minimum | 3.3% | 3.3% |
| Maximum | 100.0% | 40.8% |
| Range | 96.7% | 37.5% |
| Mean | 39.8% | 17.8% |
| Median | 32.7% | 16.4% |
| Interquartile 25% (IQ1) | 24.9% | 10.6% |
| Interquartile 75% (IQ3) | 45.5% | 23.2% |
| Interquartile Range (IQR) | 20.6% | 12.6% |
| Standard Deviation (Sample) | 24.0% | 9.6% |
| Standard Deviation (Population) | 23.7% | 9.4% |
Similar Demographics by Child Poverty Under the Age of 5
Demographics Similar to Africans by Child Poverty Under the Age of 5
In terms of child poverty under the age of 5, the demographic groups most similar to Africans are Seminole (22.8%, a difference of 0.050%), Houma (22.7%, a difference of 0.41%), Immigrants from Dominica (22.7%, a difference of 0.55%), Immigrants from Bahamas (22.7%, a difference of 0.59%), and Honduran (23.0%, a difference of 0.64%).
| Demographics | Rating | Rank | Child Poverty Under the Age of 5 |
| Inupiat | 0.0 /100 | #303 | Tragic 22.0% |
| Immigrants | Guatemala | 0.0 /100 | #304 | Tragic 22.0% |
| Immigrants | Mexico | 0.0 /100 | #305 | Tragic 22.2% |
| Indonesians | 0.0 /100 | #306 | Tragic 22.3% |
| Immigrants | Bahamas | 0.0 /100 | #307 | Tragic 22.7% |
| Immigrants | Dominica | 0.0 /100 | #308 | Tragic 22.7% |
| Houma | 0.0 /100 | #309 | Tragic 22.7% |
| Africans | 0.0 /100 | #310 | Tragic 22.8% |
| Seminole | 0.0 /100 | #311 | Tragic 22.8% |
| Hondurans | 0.0 /100 | #312 | Tragic 23.0% |
| Bahamians | 0.0 /100 | #313 | Tragic 23.0% |
| U.S. Virgin Islanders | 0.0 /100 | #314 | Tragic 23.0% |
| Arapaho | 0.0 /100 | #315 | Tragic 23.1% |
| Yakama | 0.0 /100 | #316 | Tragic 23.1% |
| Menominee | 0.0 /100 | #317 | Tragic 23.3% |
Demographics Similar to Immigrants from the Azores by Child Poverty Under the Age of 5
In terms of child poverty under the age of 5, the demographic groups most similar to Immigrants from the Azores are German Russian (18.8%, a difference of 0.36%), Immigrants from Nigeria (19.0%, a difference of 0.56%), Delaware (18.7%, a difference of 0.67%), Alsatian (19.1%, a difference of 1.1%), and Cuban (19.1%, a difference of 1.1%).
| Demographics | Rating | Rank | Child Poverty Under the Age of 5 |
| Immigrants | Thailand | 8.6 /100 | #213 | Tragic 18.3% |
| Malaysians | 6.5 /100 | #214 | Tragic 18.4% |
| Immigrants | Panama | 6.0 /100 | #215 | Tragic 18.5% |
| Hmong | 5.0 /100 | #216 | Tragic 18.5% |
| Immigrants | Africa | 4.6 /100 | #217 | Tragic 18.6% |
| Delaware | 3.4 /100 | #218 | Tragic 18.7% |
| German Russians | 3.0 /100 | #219 | Tragic 18.8% |
| Immigrants | Azores | 2.6 /100 | #220 | Tragic 18.9% |
| Immigrants | Nigeria | 2.1 /100 | #221 | Tragic 19.0% |
| Alsatians | 1.7 /100 | #222 | Tragic 19.1% |
| Cubans | 1.7 /100 | #223 | Tragic 19.1% |
| Nicaraguans | 1.6 /100 | #224 | Tragic 19.1% |
| Nigerians | 1.6 /100 | #225 | Tragic 19.1% |
| Immigrants | Eritrea | 1.5 /100 | #226 | Tragic 19.1% |
| Cape Verdeans | 1.4 /100 | #227 | Tragic 19.1% |