Immigrants from Spain vs Puerto Rican Male Poverty
COMPARE
Immigrants from Spain
Puerto Rican
Male Poverty
Male Poverty Comparison
Immigrants from Spain
Puerto Ricans
11.1%
MALE POVERTY
55.5/ 100
METRIC RATING
165th/ 347
METRIC RANK
22.0%
MALE POVERTY
0.0/ 100
METRIC RATING
345th/ 347
METRIC RANK
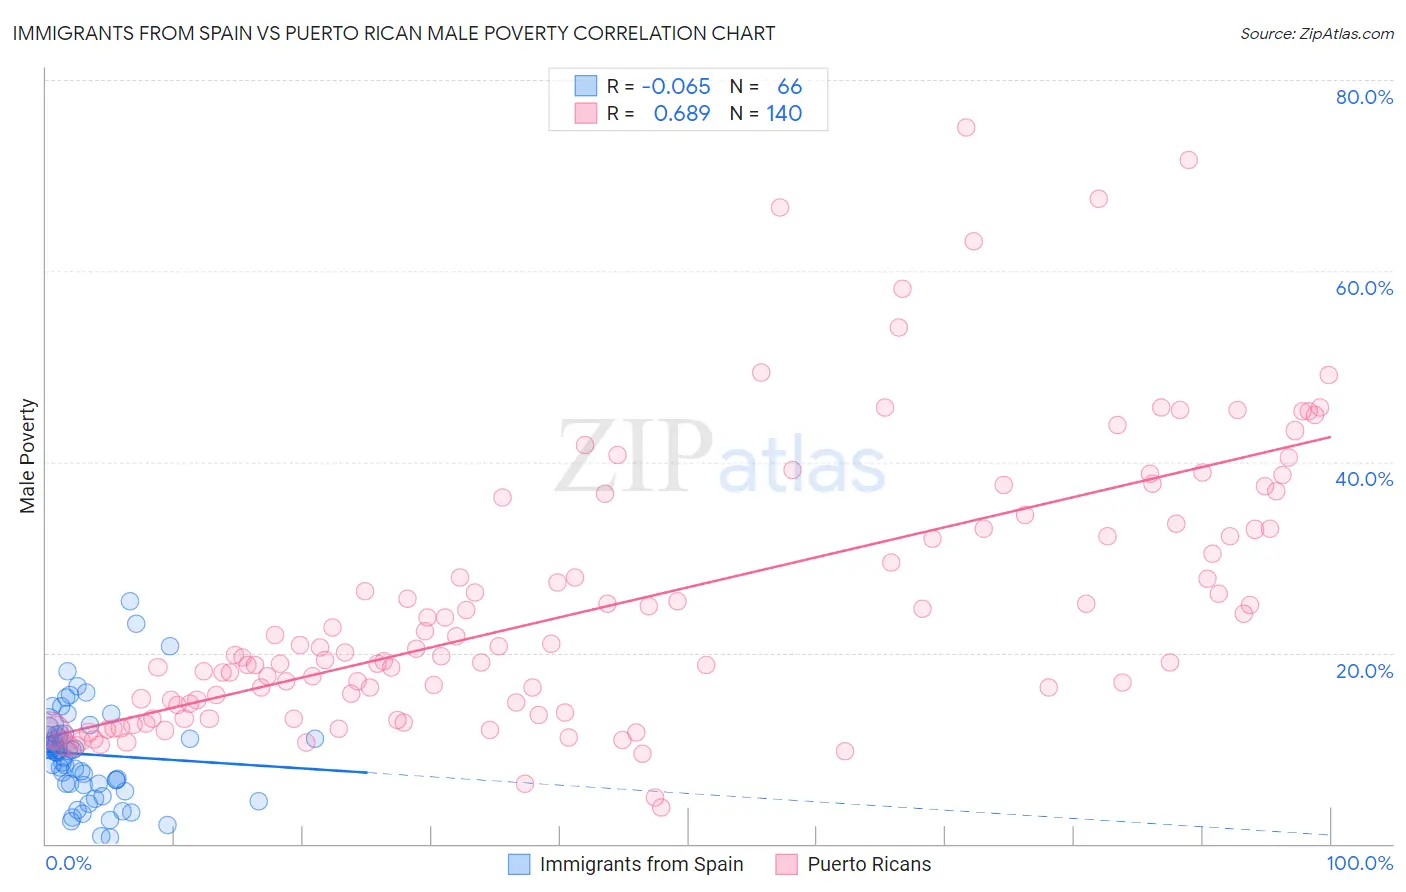
Immigrants from Spain vs Puerto Rican Male Poverty Correlation Chart
The statistical analysis conducted on geographies consisting of 239,541,780 people shows a slight negative correlation between the proportion of Immigrants from Spain and poverty level among males in the United States with a correlation coefficient (R) of -0.065 and weighted average of 11.1%. Similarly, the statistical analysis conducted on geographies consisting of 527,291,873 people shows a significant positive correlation between the proportion of Puerto Ricans and poverty level among males in the United States with a correlation coefficient (R) of 0.689 and weighted average of 22.0%, a difference of 98.1%.
Male Poverty Correlation Summary
| Measurement | Immigrants from Spain | Puerto Rican |
| Minimum | 0.62% | 3.8% |
| Maximum | 25.4% | 75.1% |
| Range | 24.7% | 71.3% |
| Mean | 9.4% | 25.0% |
| Median | 9.7% | 19.9% |
| Interquartile 25% (IQ1) | 6.2% | 14.1% |
| Interquartile 75% (IQ3) | 11.6% | 33.0% |
| Interquartile Range (IQR) | 5.3% | 18.8% |
| Standard Deviation (Sample) | 5.0% | 14.4% |
| Standard Deviation (Population) | 5.0% | 14.4% |
Similar Demographics by Male Poverty
Demographics Similar to Immigrants from Spain by Male Poverty
In terms of male poverty, the demographic groups most similar to Immigrants from Spain are Immigrants from Albania (11.1%, a difference of 0.020%), Hungarian (11.1%, a difference of 0.040%), Immigrants from Portugal (11.1%, a difference of 0.060%), White/Caucasian (11.1%, a difference of 0.12%), and Ethiopian (11.1%, a difference of 0.12%).
| Demographics | Rating | Rank | Male Poverty |
| Colombians | 63.0 /100 | #158 | Good 11.0% |
| Taiwanese | 62.7 /100 | #159 | Good 11.0% |
| Soviet Union | 60.3 /100 | #160 | Good 11.1% |
| Immigrants | Northern Africa | 59.7 /100 | #161 | Average 11.1% |
| Immigrants | Chile | 57.4 /100 | #162 | Average 11.1% |
| Whites/Caucasians | 56.7 /100 | #163 | Average 11.1% |
| Ethiopians | 56.7 /100 | #164 | Average 11.1% |
| Immigrants | Spain | 55.5 /100 | #165 | Average 11.1% |
| Immigrants | Albania | 55.3 /100 | #166 | Average 11.1% |
| Hungarians | 55.1 /100 | #167 | Average 11.1% |
| Immigrants | Portugal | 54.9 /100 | #168 | Average 11.1% |
| Immigrants | Colombia | 54.2 /100 | #169 | Average 11.1% |
| South Americans | 53.8 /100 | #170 | Average 11.1% |
| Uruguayans | 51.0 /100 | #171 | Average 11.2% |
| Immigrants | Ethiopia | 50.7 /100 | #172 | Average 11.2% |
Demographics Similar to Puerto Ricans by Male Poverty
In terms of male poverty, the demographic groups most similar to Puerto Ricans are Navajo (22.3%, a difference of 1.3%), Tohono O'odham (22.9%, a difference of 3.9%), Hopi (20.8%, a difference of 5.9%), Yup'ik (20.4%, a difference of 8.1%), and Pima (20.4%, a difference of 8.2%).
| Demographics | Rating | Rank | Male Poverty |
| Natives/Alaskans | 0.0 /100 | #333 | Tragic 16.9% |
| Cheyenne | 0.0 /100 | #334 | Tragic 17.6% |
| Apache | 0.0 /100 | #335 | Tragic 17.7% |
| Pueblo | 0.0 /100 | #336 | Tragic 18.5% |
| Sioux | 0.0 /100 | #337 | Tragic 18.7% |
| Crow | 0.0 /100 | #338 | Tragic 19.1% |
| Yuman | 0.0 /100 | #339 | Tragic 19.5% |
| Immigrants | Yemen | 0.0 /100 | #340 | Tragic 20.1% |
| Lumbee | 0.0 /100 | #341 | Tragic 20.2% |
| Pima | 0.0 /100 | #342 | Tragic 20.4% |
| Yup'ik | 0.0 /100 | #343 | Tragic 20.4% |
| Hopi | 0.0 /100 | #344 | Tragic 20.8% |
| Puerto Ricans | 0.0 /100 | #345 | Tragic 22.0% |
| Navajo | 0.0 /100 | #346 | Tragic 22.3% |
| Tohono O'odham | 0.0 /100 | #347 | Tragic 22.9% |