Immigrants from Spain vs Immigrants from Cameroon Male Poverty
COMPARE
Immigrants from Spain
Immigrants from Cameroon
Male Poverty
Male Poverty Comparison
Immigrants from Spain
Immigrants from Cameroon
11.1%
MALE POVERTY
55.5/ 100
METRIC RATING
165th/ 347
METRIC RANK
11.2%
MALE POVERTY
44.5/ 100
METRIC RATING
178th/ 347
METRIC RANK
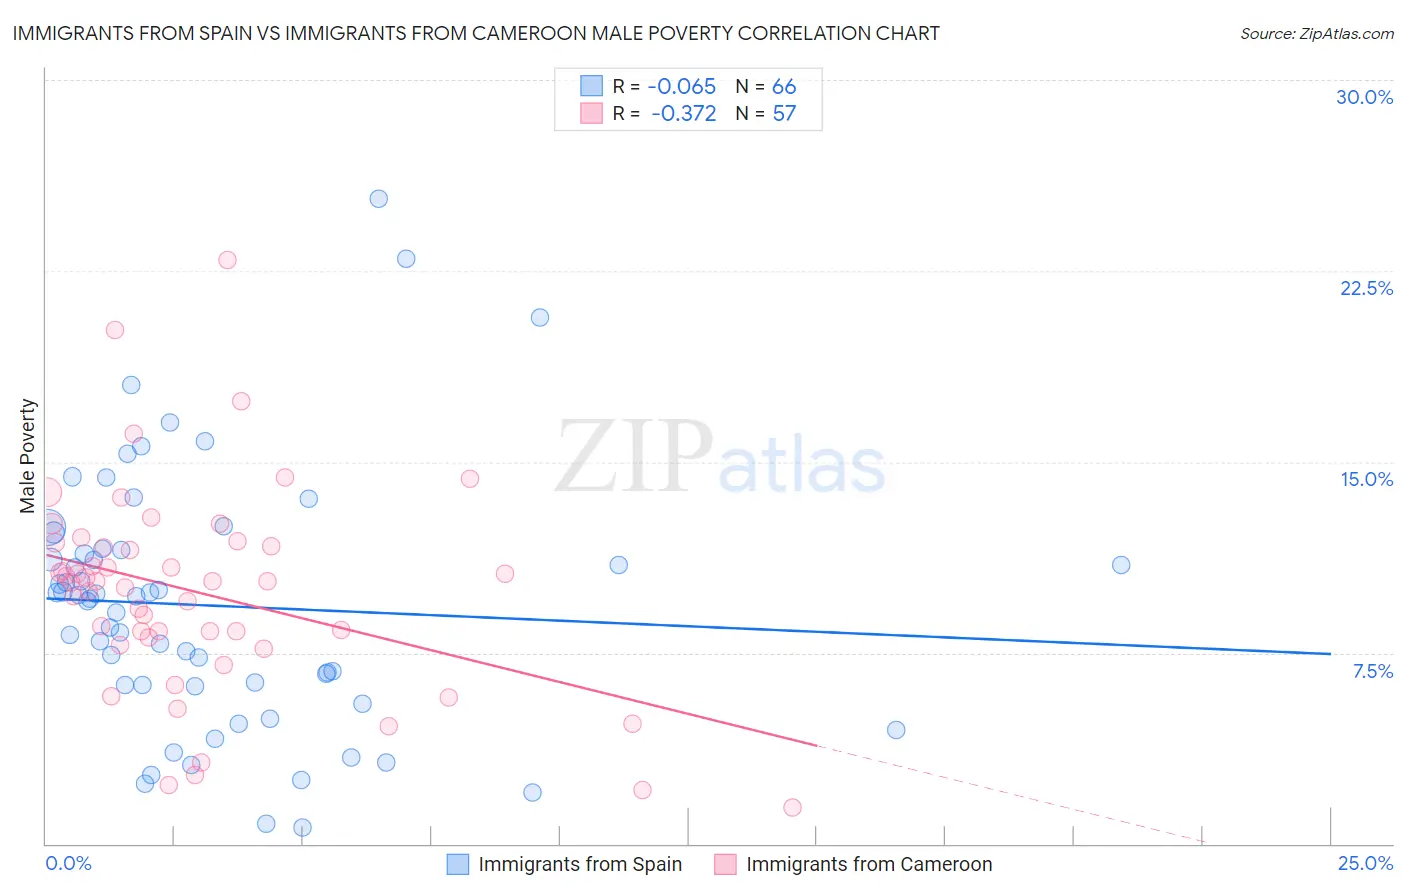
Immigrants from Spain vs Immigrants from Cameroon Male Poverty Correlation Chart
The statistical analysis conducted on geographies consisting of 239,541,780 people shows a slight negative correlation between the proportion of Immigrants from Spain and poverty level among males in the United States with a correlation coefficient (R) of -0.065 and weighted average of 11.1%. Similarly, the statistical analysis conducted on geographies consisting of 130,706,332 people shows a mild negative correlation between the proportion of Immigrants from Cameroon and poverty level among males in the United States with a correlation coefficient (R) of -0.372 and weighted average of 11.2%, a difference of 1.1%.
Male Poverty Correlation Summary
| Measurement | Immigrants from Spain | Immigrants from Cameroon |
| Minimum | 0.62% | 1.4% |
| Maximum | 25.4% | 22.9% |
| Range | 24.7% | 21.5% |
| Mean | 9.4% | 9.8% |
| Median | 9.7% | 10.3% |
| Interquartile 25% (IQ1) | 6.2% | 8.0% |
| Interquartile 75% (IQ3) | 11.6% | 11.7% |
| Interquartile Range (IQR) | 5.3% | 3.8% |
| Standard Deviation (Sample) | 5.0% | 4.1% |
| Standard Deviation (Population) | 5.0% | 4.1% |
Demographics Similar to Immigrants from Spain and Immigrants from Cameroon by Male Poverty
In terms of male poverty, the demographic groups most similar to Immigrants from Spain are Immigrants from Albania (11.1%, a difference of 0.020%), Hungarian (11.1%, a difference of 0.040%), Immigrants from Portugal (11.1%, a difference of 0.060%), White/Caucasian (11.1%, a difference of 0.12%), and Ethiopian (11.1%, a difference of 0.12%). Similarly, the demographic groups most similar to Immigrants from Cameroon are Lebanese (11.2%, a difference of 0.11%), Immigrants from Fiji (11.2%, a difference of 0.15%), Celtic (11.2%, a difference of 0.29%), Immigrants from Syria (11.3%, a difference of 0.43%), and Immigrants from Morocco (11.3%, a difference of 0.44%).
| Demographics | Rating | Rank | Male Poverty |
| Immigrants | Northern Africa | 59.7 /100 | #161 | Average 11.1% |
| Immigrants | Chile | 57.4 /100 | #162 | Average 11.1% |
| Whites/Caucasians | 56.7 /100 | #163 | Average 11.1% |
| Ethiopians | 56.7 /100 | #164 | Average 11.1% |
| Immigrants | Spain | 55.5 /100 | #165 | Average 11.1% |
| Immigrants | Albania | 55.3 /100 | #166 | Average 11.1% |
| Hungarians | 55.1 /100 | #167 | Average 11.1% |
| Immigrants | Portugal | 54.9 /100 | #168 | Average 11.1% |
| Immigrants | Colombia | 54.2 /100 | #169 | Average 11.1% |
| South Americans | 53.8 /100 | #170 | Average 11.1% |
| Uruguayans | 51.0 /100 | #171 | Average 11.2% |
| Immigrants | Ethiopia | 50.7 /100 | #172 | Average 11.2% |
| Pennsylvania Germans | 50.5 /100 | #173 | Average 11.2% |
| Immigrants | Oceania | 50.0 /100 | #174 | Average 11.2% |
| Celtics | 47.5 /100 | #175 | Average 11.2% |
| Immigrants | Fiji | 46.0 /100 | #176 | Average 11.2% |
| Lebanese | 45.6 /100 | #177 | Average 11.2% |
| Immigrants | Cameroon | 44.5 /100 | #178 | Average 11.2% |
| Immigrants | Syria | 40.3 /100 | #179 | Average 11.3% |
| Immigrants | Morocco | 40.1 /100 | #180 | Average 11.3% |
| Immigrants | Costa Rica | 39.5 /100 | #181 | Fair 11.3% |