Immigrants from Spain vs Chilean Male Poverty
COMPARE
Immigrants from Spain
Chilean
Male Poverty
Male Poverty Comparison
Immigrants from Spain
Chileans
11.1%
MALE POVERTY
55.5/ 100
METRIC RATING
165th/ 347
METRIC RANK
10.7%
MALE POVERTY
83.9/ 100
METRIC RATING
130th/ 347
METRIC RANK
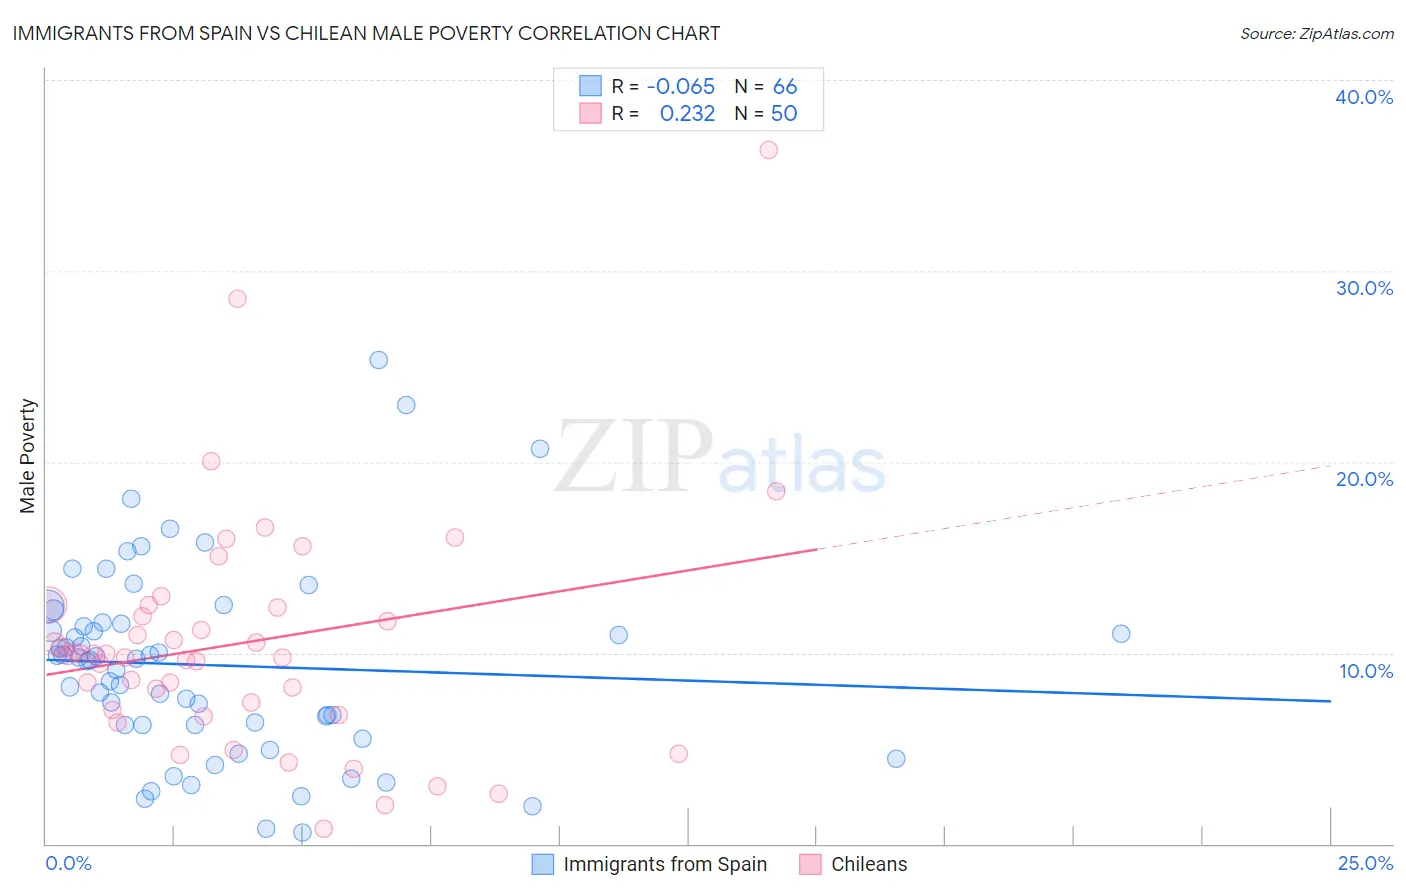
Immigrants from Spain vs Chilean Male Poverty Correlation Chart
The statistical analysis conducted on geographies consisting of 239,541,780 people shows a slight negative correlation between the proportion of Immigrants from Spain and poverty level among males in the United States with a correlation coefficient (R) of -0.065 and weighted average of 11.1%. Similarly, the statistical analysis conducted on geographies consisting of 256,512,426 people shows a weak positive correlation between the proportion of Chileans and poverty level among males in the United States with a correlation coefficient (R) of 0.232 and weighted average of 10.7%, a difference of 3.6%.
Male Poverty Correlation Summary
| Measurement | Immigrants from Spain | Chilean |
| Minimum | 0.62% | 0.80% |
| Maximum | 25.4% | 36.4% |
| Range | 24.7% | 35.6% |
| Mean | 9.4% | 10.5% |
| Median | 9.7% | 9.9% |
| Interquartile 25% (IQ1) | 6.2% | 7.0% |
| Interquartile 75% (IQ3) | 11.6% | 12.4% |
| Interquartile Range (IQR) | 5.3% | 5.3% |
| Standard Deviation (Sample) | 5.0% | 6.2% |
| Standard Deviation (Population) | 5.0% | 6.1% |
Similar Demographics by Male Poverty
Demographics Similar to Immigrants from Spain by Male Poverty
In terms of male poverty, the demographic groups most similar to Immigrants from Spain are Immigrants from Albania (11.1%, a difference of 0.020%), Hungarian (11.1%, a difference of 0.040%), Immigrants from Portugal (11.1%, a difference of 0.060%), White/Caucasian (11.1%, a difference of 0.12%), and Ethiopian (11.1%, a difference of 0.12%).
| Demographics | Rating | Rank | Male Poverty |
| Colombians | 63.0 /100 | #158 | Good 11.0% |
| Taiwanese | 62.7 /100 | #159 | Good 11.0% |
| Soviet Union | 60.3 /100 | #160 | Good 11.1% |
| Immigrants | Northern Africa | 59.7 /100 | #161 | Average 11.1% |
| Immigrants | Chile | 57.4 /100 | #162 | Average 11.1% |
| Whites/Caucasians | 56.7 /100 | #163 | Average 11.1% |
| Ethiopians | 56.7 /100 | #164 | Average 11.1% |
| Immigrants | Spain | 55.5 /100 | #165 | Average 11.1% |
| Immigrants | Albania | 55.3 /100 | #166 | Average 11.1% |
| Hungarians | 55.1 /100 | #167 | Average 11.1% |
| Immigrants | Portugal | 54.9 /100 | #168 | Average 11.1% |
| Immigrants | Colombia | 54.2 /100 | #169 | Average 11.1% |
| South Americans | 53.8 /100 | #170 | Average 11.1% |
| Uruguayans | 51.0 /100 | #171 | Average 11.2% |
| Immigrants | Ethiopia | 50.7 /100 | #172 | Average 11.2% |
Demographics Similar to Chileans by Male Poverty
In terms of male poverty, the demographic groups most similar to Chileans are Immigrants from Peru (10.7%, a difference of 0.050%), Immigrants from Western Europe (10.7%, a difference of 0.060%), Puget Sound Salish (10.7%, a difference of 0.070%), Immigrants from Ukraine (10.7%, a difference of 0.080%), and Immigrants from Belarus (10.7%, a difference of 0.11%).
| Demographics | Rating | Rank | Male Poverty |
| South Africans | 86.8 /100 | #123 | Excellent 10.7% |
| French | 86.7 /100 | #124 | Excellent 10.7% |
| Immigrants | Norway | 86.0 /100 | #125 | Excellent 10.7% |
| Immigrants | Ukraine | 84.3 /100 | #126 | Excellent 10.7% |
| Puget Sound Salish | 84.3 /100 | #127 | Excellent 10.7% |
| Immigrants | Western Europe | 84.2 /100 | #128 | Excellent 10.7% |
| Immigrants | Peru | 84.1 /100 | #129 | Excellent 10.7% |
| Chileans | 83.9 /100 | #130 | Excellent 10.7% |
| Immigrants | Belarus | 83.3 /100 | #131 | Excellent 10.7% |
| Immigrants | Vietnam | 83.0 /100 | #132 | Excellent 10.8% |
| Pakistanis | 83.0 /100 | #133 | Excellent 10.8% |
| New Zealanders | 82.9 /100 | #134 | Excellent 10.8% |
| Brazilians | 82.7 /100 | #135 | Excellent 10.8% |
| Immigrants | Israel | 80.9 /100 | #136 | Excellent 10.8% |
| Immigrants | Switzerland | 79.2 /100 | #137 | Good 10.8% |