Immigrants from Spain vs Laotian Median Female Earnings
COMPARE
Immigrants from Spain
Laotian
Median Female Earnings
Median Female Earnings Comparison
Immigrants from Spain
Laotians
$42,815
MEDIAN FEMALE EARNINGS
99.8/ 100
METRIC RATING
69th/ 347
METRIC RANK
$42,133
MEDIAN FEMALE EARNINGS
99.4/ 100
METRIC RATING
85th/ 347
METRIC RANK
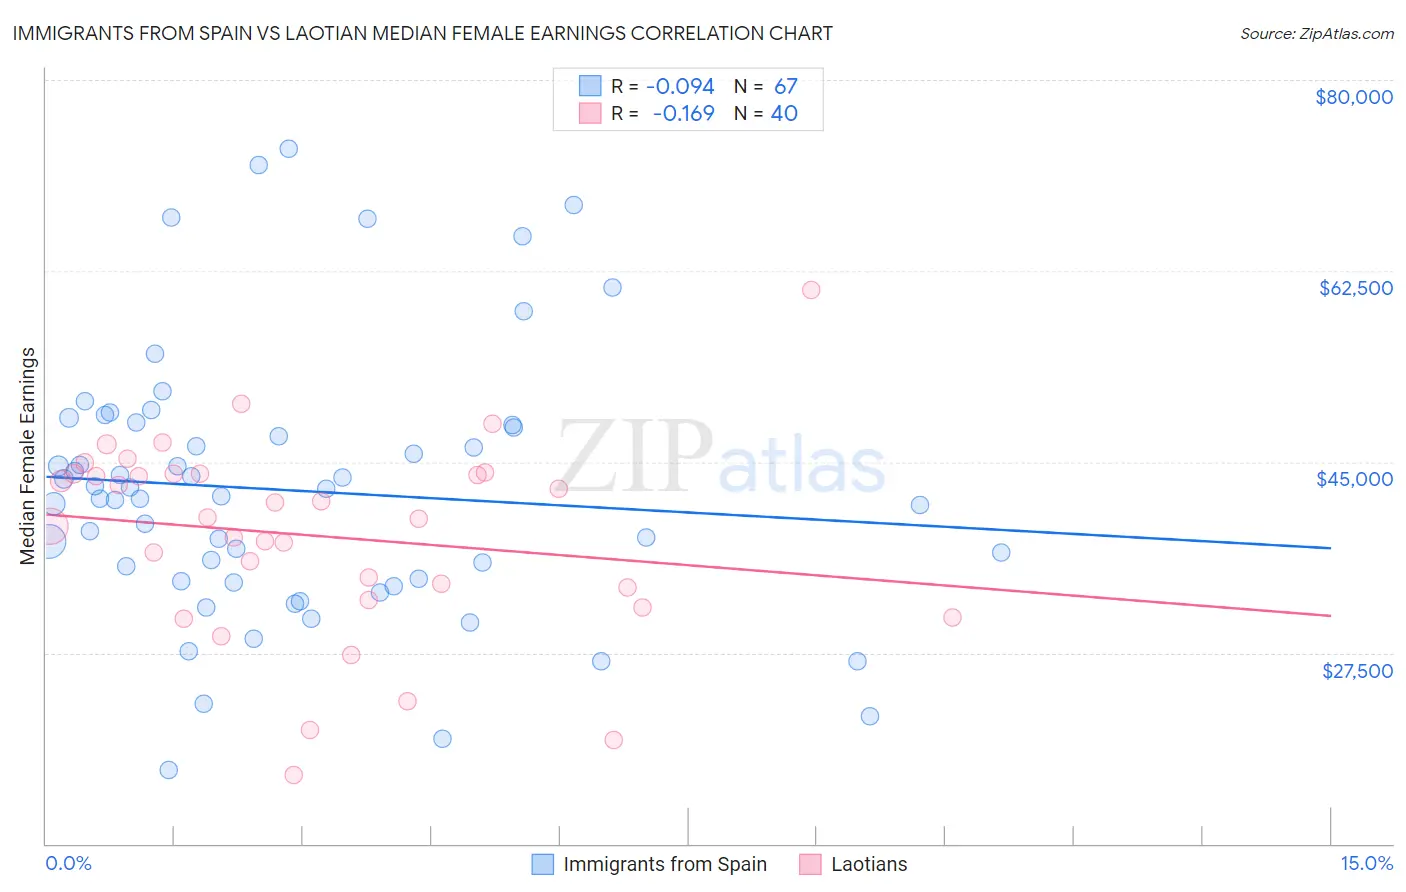
Immigrants from Spain vs Laotian Median Female Earnings Correlation Chart
The statistical analysis conducted on geographies consisting of 239,646,958 people shows a slight negative correlation between the proportion of Immigrants from Spain and median female earnings in the United States with a correlation coefficient (R) of -0.094 and weighted average of $42,815. Similarly, the statistical analysis conducted on geographies consisting of 224,815,855 people shows a poor negative correlation between the proportion of Laotians and median female earnings in the United States with a correlation coefficient (R) of -0.169 and weighted average of $42,133, a difference of 1.6%.
Median Female Earnings Correlation Summary
| Measurement | Immigrants from Spain | Laotian |
| Minimum | $16,765 | $16,291 |
| Maximum | $73,707 | $60,722 |
| Range | $56,942 | $44,431 |
| Mean | $42,367 | $38,224 |
| Median | $41,842 | $39,876 |
| Interquartile 25% (IQ1) | $34,065 | $32,877 |
| Interquartile 75% (IQ3) | $48,345 | $43,879 |
| Interquartile Range (IQR) | $14,280 | $11,002 |
| Standard Deviation (Sample) | $12,186 | $8,986 |
| Standard Deviation (Population) | $12,095 | $8,873 |
Demographics Similar to Immigrants from Spain and Laotians by Median Female Earnings
In terms of median female earnings, the demographic groups most similar to Immigrants from Spain are Immigrants from Austria ($42,824, a difference of 0.020%), Immigrants from Egypt ($42,837, a difference of 0.050%), Immigrants from Ethiopia ($42,744, a difference of 0.17%), Immigrants from Romania ($42,718, a difference of 0.23%), and Albanian ($42,584, a difference of 0.54%). Similarly, the demographic groups most similar to Laotians are Immigrants from St. Vincent and the Grenadines ($42,108, a difference of 0.060%), Lithuanian ($42,108, a difference of 0.060%), Immigrants from Sierra Leone ($42,214, a difference of 0.19%), Armenian ($42,212, a difference of 0.19%), and Immigrants from Morocco ($42,229, a difference of 0.23%).
| Demographics | Rating | Rank | Median Female Earnings |
| Immigrants | Egypt | 99.9 /100 | #67 | Exceptional $42,837 |
| Immigrants | Austria | 99.8 /100 | #68 | Exceptional $42,824 |
| Immigrants | Spain | 99.8 /100 | #69 | Exceptional $42,815 |
| Immigrants | Ethiopia | 99.8 /100 | #70 | Exceptional $42,744 |
| Immigrants | Romania | 99.8 /100 | #71 | Exceptional $42,718 |
| Albanians | 99.8 /100 | #72 | Exceptional $42,584 |
| Mongolians | 99.7 /100 | #73 | Exceptional $42,542 |
| Immigrants | South Africa | 99.7 /100 | #74 | Exceptional $42,508 |
| New Zealanders | 99.7 /100 | #75 | Exceptional $42,446 |
| Immigrants | Italy | 99.7 /100 | #76 | Exceptional $42,446 |
| Immigrants | Albania | 99.6 /100 | #77 | Exceptional $42,388 |
| Immigrants | Kazakhstan | 99.6 /100 | #78 | Exceptional $42,386 |
| Greeks | 99.6 /100 | #79 | Exceptional $42,336 |
| Immigrants | Moldova | 99.6 /100 | #80 | Exceptional $42,304 |
| Immigrants | Southern Europe | 99.5 /100 | #81 | Exceptional $42,275 |
| Immigrants | Morocco | 99.5 /100 | #82 | Exceptional $42,229 |
| Immigrants | Sierra Leone | 99.5 /100 | #83 | Exceptional $42,214 |
| Armenians | 99.5 /100 | #84 | Exceptional $42,212 |
| Laotians | 99.4 /100 | #85 | Exceptional $42,133 |
| Immigrants | St. Vincent and the Grenadines | 99.3 /100 | #86 | Exceptional $42,108 |
| Lithuanians | 99.3 /100 | #87 | Exceptional $42,108 |