Immigrants from Spain vs Comanche Child Poverty Under the Age of 5
COMPARE
Immigrants from Spain
Comanche
Child Poverty Under the Age of 5
Child Poverty Under the Age of 5 Comparison
Immigrants from Spain
Comanche
15.9%
CHILD POVERTY UNDER THE AGE OF 5
94.8/ 100
METRIC RATING
105th/ 347
METRIC RANK
21.0%
CHILD POVERTY UNDER THE AGE OF 5
0.0/ 100
METRIC RATING
283rd/ 347
METRIC RANK
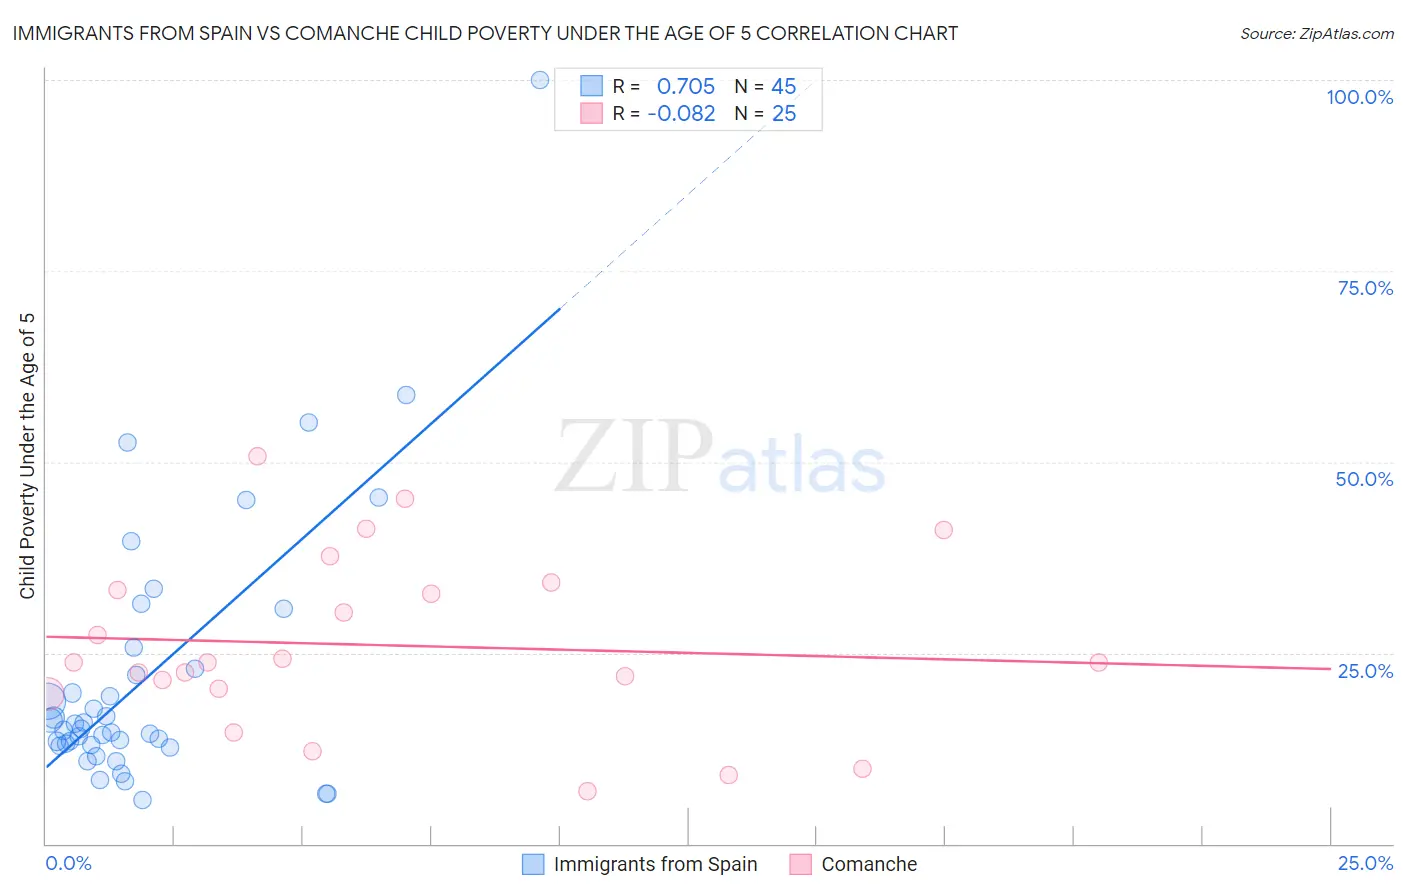
Immigrants from Spain vs Comanche Child Poverty Under the Age of 5 Correlation Chart
The statistical analysis conducted on geographies consisting of 232,438,650 people shows a strong positive correlation between the proportion of Immigrants from Spain and poverty level among children under the age of 5 in the United States with a correlation coefficient (R) of 0.705 and weighted average of 15.9%. Similarly, the statistical analysis conducted on geographies consisting of 108,975,573 people shows a slight negative correlation between the proportion of Comanche and poverty level among children under the age of 5 in the United States with a correlation coefficient (R) of -0.082 and weighted average of 21.0%, a difference of 32.1%.
Child Poverty Under the Age of 5 Correlation Summary
| Measurement | Immigrants from Spain | Comanche |
| Minimum | 5.8% | 6.9% |
| Maximum | 100.0% | 50.7% |
| Range | 94.2% | 43.8% |
| Mean | 22.0% | 26.0% |
| Median | 15.1% | 23.8% |
| Interquartile 25% (IQ1) | 12.9% | 20.0% |
| Interquartile 75% (IQ3) | 24.3% | 33.8% |
| Interquartile Range (IQR) | 11.4% | 13.8% |
| Standard Deviation (Sample) | 17.8% | 11.5% |
| Standard Deviation (Population) | 17.6% | 11.2% |
Similar Demographics by Child Poverty Under the Age of 5
Demographics Similar to Immigrants from Spain by Child Poverty Under the Age of 5
In terms of child poverty under the age of 5, the demographic groups most similar to Immigrants from Spain are Tlingit-Haida (15.9%, a difference of 0.050%), Immigrants from North America (15.9%, a difference of 0.080%), Slovene (16.0%, a difference of 0.19%), Immigrants from Brazil (16.0%, a difference of 0.21%), and European (15.9%, a difference of 0.28%).
| Demographics | Rating | Rank | Child Poverty Under the Age of 5 |
| Immigrants | South Africa | 96.1 /100 | #98 | Exceptional 15.8% |
| Palestinians | 95.9 /100 | #99 | Exceptional 15.8% |
| Immigrants | Canada | 95.9 /100 | #100 | Exceptional 15.8% |
| Immigrants | Zimbabwe | 95.9 /100 | #101 | Exceptional 15.8% |
| Armenians | 95.7 /100 | #102 | Exceptional 15.8% |
| Europeans | 95.3 /100 | #103 | Exceptional 15.9% |
| Immigrants | North America | 94.9 /100 | #104 | Exceptional 15.9% |
| Immigrants | Spain | 94.8 /100 | #105 | Exceptional 15.9% |
| Tlingit-Haida | 94.7 /100 | #106 | Exceptional 15.9% |
| Slovenes | 94.4 /100 | #107 | Exceptional 16.0% |
| Immigrants | Brazil | 94.4 /100 | #108 | Exceptional 16.0% |
| Northern Europeans | 94.3 /100 | #109 | Exceptional 16.0% |
| Romanians | 94.3 /100 | #110 | Exceptional 16.0% |
| Pakistanis | 94.2 /100 | #111 | Exceptional 16.0% |
| Peruvians | 94.1 /100 | #112 | Exceptional 16.0% |
Demographics Similar to Comanche by Child Poverty Under the Age of 5
In terms of child poverty under the age of 5, the demographic groups most similar to Comanche are Potawatomi (21.0%, a difference of 0.20%), Somali (21.1%, a difference of 0.33%), Senegalese (20.9%, a difference of 0.74%), Haitian (21.2%, a difference of 0.80%), and Immigrants from Latin America (21.2%, a difference of 0.88%).
| Demographics | Rating | Rank | Child Poverty Under the Age of 5 |
| West Indians | 0.0 /100 | #276 | Tragic 20.6% |
| Immigrants | West Indies | 0.0 /100 | #277 | Tragic 20.7% |
| Immigrants | Grenada | 0.0 /100 | #278 | Tragic 20.7% |
| Sub-Saharan Africans | 0.0 /100 | #279 | Tragic 20.8% |
| French American Indians | 0.0 /100 | #280 | Tragic 20.8% |
| Senegalese | 0.0 /100 | #281 | Tragic 20.9% |
| Potawatomi | 0.0 /100 | #282 | Tragic 21.0% |
| Comanche | 0.0 /100 | #283 | Tragic 21.0% |
| Somalis | 0.0 /100 | #284 | Tragic 21.1% |
| Haitians | 0.0 /100 | #285 | Tragic 21.2% |
| Immigrants | Latin America | 0.0 /100 | #286 | Tragic 21.2% |
| Immigrants | Zaire | 0.0 /100 | #287 | Tragic 21.3% |
| Immigrants | Senegal | 0.0 /100 | #288 | Tragic 21.3% |
| Immigrants | Haiti | 0.0 /100 | #289 | Tragic 21.3% |
| Immigrants | Caribbean | 0.0 /100 | #290 | Tragic 21.4% |