Immigrants from Southern Europe vs Immigrants from Jamaica Child Poverty Under the Age of 16
COMPARE
Immigrants from Southern Europe
Immigrants from Jamaica
Child Poverty Under the Age of 16
Child Poverty Under the Age of 16 Comparison
Immigrants from Southern Europe
Immigrants from Jamaica
15.1%
CHILD POVERTY UNDER THE AGE OF 16
89.7/ 100
METRIC RATING
129th/ 347
METRIC RANK
19.8%
CHILD POVERTY UNDER THE AGE OF 16
0.1/ 100
METRIC RATING
273rd/ 347
METRIC RANK
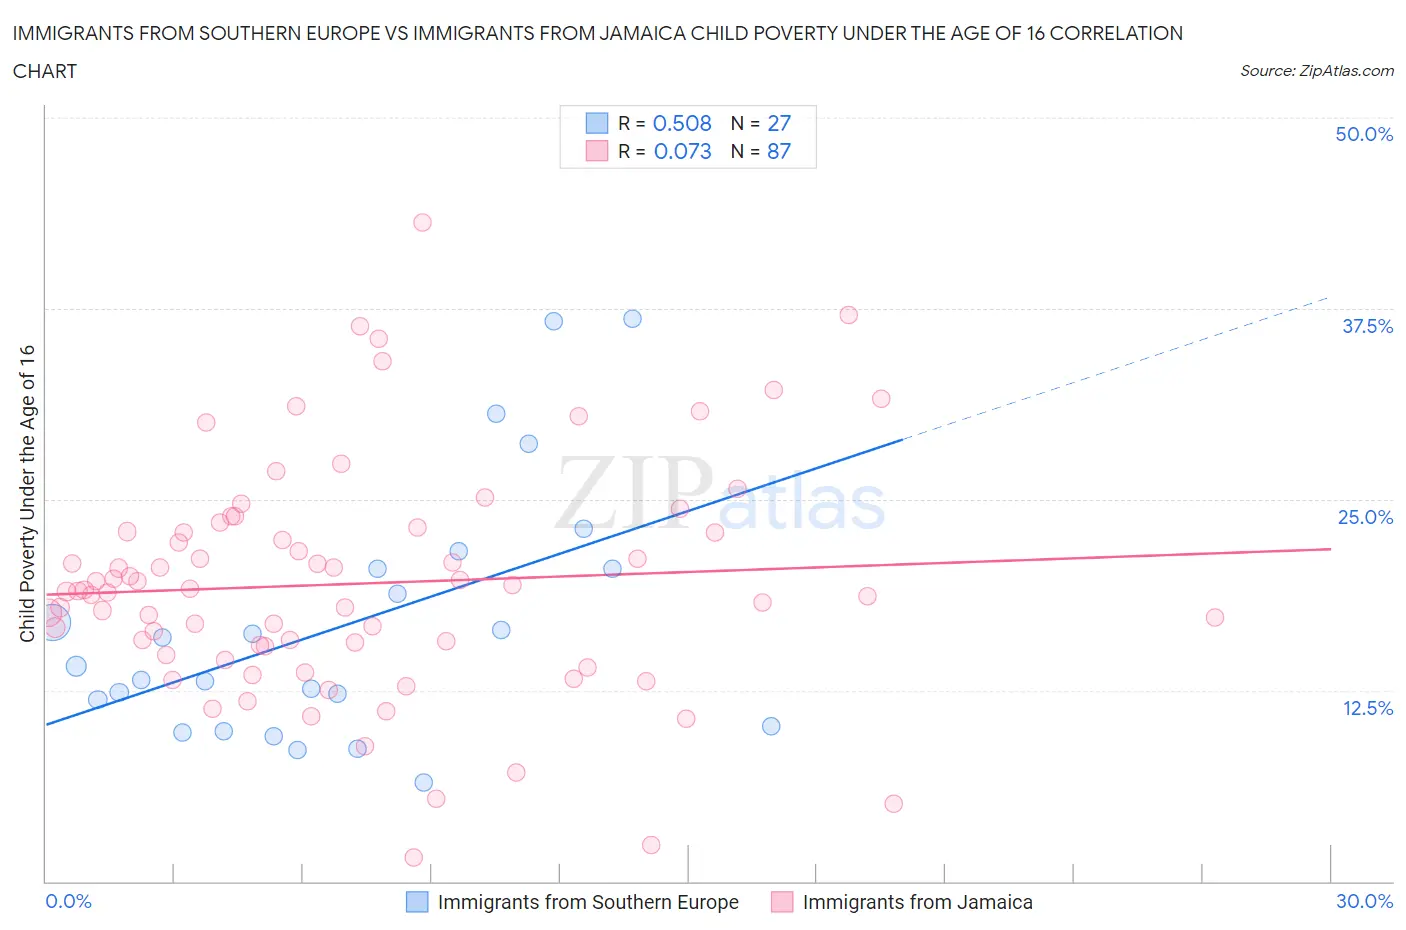
Immigrants from Southern Europe vs Immigrants from Jamaica Child Poverty Under the Age of 16 Correlation Chart
The statistical analysis conducted on geographies consisting of 397,776,906 people shows a substantial positive correlation between the proportion of Immigrants from Southern Europe and poverty level among children under the age of 16 in the United States with a correlation coefficient (R) of 0.508 and weighted average of 15.1%. Similarly, the statistical analysis conducted on geographies consisting of 299,947,677 people shows a slight positive correlation between the proportion of Immigrants from Jamaica and poverty level among children under the age of 16 in the United States with a correlation coefficient (R) of 0.073 and weighted average of 19.8%, a difference of 30.8%.
Child Poverty Under the Age of 16 Correlation Summary
| Measurement | Immigrants from Southern Europe | Immigrants from Jamaica |
| Minimum | 6.5% | 1.6% |
| Maximum | 36.8% | 43.2% |
| Range | 30.3% | 41.6% |
| Mean | 16.9% | 19.5% |
| Median | 14.1% | 19.0% |
| Interquartile 25% (IQ1) | 10.1% | 15.4% |
| Interquartile 75% (IQ3) | 20.4% | 22.9% |
| Interquartile Range (IQR) | 10.3% | 7.5% |
| Standard Deviation (Sample) | 8.3% | 7.6% |
| Standard Deviation (Population) | 8.1% | 7.5% |
Similar Demographics by Child Poverty Under the Age of 16
Demographics Similar to Immigrants from Southern Europe by Child Poverty Under the Age of 16
In terms of child poverty under the age of 16, the demographic groups most similar to Immigrants from Southern Europe are Mongolian (15.2%, a difference of 0.10%), Armenian (15.2%, a difference of 0.12%), Immigrants from Kazakhstan (15.1%, a difference of 0.15%), Immigrants from Western Europe (15.1%, a difference of 0.21%), and Canadian (15.2%, a difference of 0.22%).
| Demographics | Rating | Rank | Child Poverty Under the Age of 16 |
| Pakistanis | 91.7 /100 | #122 | Exceptional 15.0% |
| Immigrants | Brazil | 91.1 /100 | #123 | Exceptional 15.1% |
| Czechoslovakians | 91.0 /100 | #124 | Exceptional 15.1% |
| Palestinians | 90.9 /100 | #125 | Exceptional 15.1% |
| Portuguese | 90.6 /100 | #126 | Exceptional 15.1% |
| Immigrants | Western Europe | 90.3 /100 | #127 | Exceptional 15.1% |
| Immigrants | Kazakhstan | 90.2 /100 | #128 | Exceptional 15.1% |
| Immigrants | Southern Europe | 89.7 /100 | #129 | Excellent 15.1% |
| Mongolians | 89.5 /100 | #130 | Excellent 15.2% |
| Armenians | 89.4 /100 | #131 | Excellent 15.2% |
| Canadians | 89.1 /100 | #132 | Excellent 15.2% |
| Immigrants | South Eastern Asia | 89.0 /100 | #133 | Excellent 15.2% |
| Native Hawaiians | 88.7 /100 | #134 | Excellent 15.2% |
| Albanians | 88.6 /100 | #135 | Excellent 15.2% |
| Immigrants | Spain | 87.3 /100 | #136 | Excellent 15.3% |
Demographics Similar to Immigrants from Jamaica by Child Poverty Under the Age of 16
In terms of child poverty under the age of 16, the demographic groups most similar to Immigrants from Jamaica are Immigrants from Cabo Verde (19.9%, a difference of 0.15%), Immigrants from Barbados (19.9%, a difference of 0.16%), Belizean (19.9%, a difference of 0.16%), Immigrants from Bangladesh (19.8%, a difference of 0.24%), and Iroquois (19.9%, a difference of 0.30%).
| Demographics | Rating | Rank | Child Poverty Under the Age of 16 |
| Liberians | 0.1 /100 | #266 | Tragic 19.5% |
| Cherokee | 0.1 /100 | #267 | Tragic 19.5% |
| Jamaicans | 0.1 /100 | #268 | Tragic 19.7% |
| Immigrants | El Salvador | 0.1 /100 | #269 | Tragic 19.7% |
| Spanish American Indians | 0.1 /100 | #270 | Tragic 19.7% |
| Immigrants | Liberia | 0.1 /100 | #271 | Tragic 19.7% |
| Immigrants | Bangladesh | 0.1 /100 | #272 | Tragic 19.8% |
| Immigrants | Jamaica | 0.1 /100 | #273 | Tragic 19.8% |
| Immigrants | Cabo Verde | 0.1 /100 | #274 | Tragic 19.9% |
| Immigrants | Barbados | 0.1 /100 | #275 | Tragic 19.9% |
| Belizeans | 0.1 /100 | #276 | Tragic 19.9% |
| Iroquois | 0.1 /100 | #277 | Tragic 19.9% |
| Bangladeshis | 0.0 /100 | #278 | Tragic 19.9% |
| Sub-Saharan Africans | 0.0 /100 | #279 | Tragic 19.9% |
| Comanche | 0.0 /100 | #280 | Tragic 19.9% |