Immigrants from Southern Europe vs Immigrants from Germany Child Poverty Under the Age of 16

COMPARE

Immigrants from Southern Europe
Race
Ancestry
AfghanAfricanAlaska NativeAlaskan AthabascanAlbanianAleutAlsatianAmericanApacheArabArapahoArgentineanArmenianAssyrian/Chaldean/SyriacAustralianAustrianBahamianBangladeshiBarbadianBasqueBelgianBelizeanBermudanBhutaneseBlackfeetBolivianBrazilianBritishBritish West IndianBulgarianBurmeseCajunCambodianCanadianCape VerdeanCarpatho RusynCelticCentral AmericanCentral American IndianCherokeeCheyenneChickasawChileanChineseChippewaChoctawColombianColvilleComancheCosta RicanCreeCreekCroatianCrowCubanCypriotCzechCzechoslovakianDanishDelawareDominicanDutchDutch West IndianEastern EuropeanEcuadorianEgyptianEnglishEstonianEthiopianEuropeanFijianFilipinoFinnishFrenchFrench American IndianFrench CanadianGermanGerman RussianGhanaianGreekGuamanian/ChamorroGuatemalanGuyaneseHaitianHmongHonduranHopiHoumaHungarianIcelanderIndian (Asian)IndonesianInupiatIranianIraqiIrishIroquoisIsraeliItalianJamaicanJapaneseJordanianKenyanKiowaKoreanLaotianLatvianLebaneseLiberianLithuanianLumbeeLuxembourgerMacedonianMalaysianMalteseMarshalleseMenomineeMexicanMexican American IndianMongolianMoroccanNative HawaiianNavajoNepaleseNew ZealanderNicaraguanNigerianNorthern EuropeanNorwegianOkinawanOsageOttawaPaiutePakistaniPalestinianPanamanianParaguayanPennsylvania GermanPeruvianPimaPolishPortuguesePotawatomiPuebloPuerto RicanPuget Sound SalishRomanianRussianSalvadoranSamoanScandinavianScotch-IrishScottishSeminoleSenegaleseSerbianShoshoneSierra LeoneanSiouxSlavicSlovakSloveneSomaliSouth AfricanSouth AmericanSouth American IndianSoviet UnionSpaniardSpanishSpanish AmericanSpanish American IndianSri LankanSubsaharan AfricanSudaneseSwedishSwissSyrianTaiwaneseThaiTlingit-HaidaTohono O'OdhamTonganTrinidadian and TobagonianTsimshianTurkishU.S. Virgin IslanderUgandanUkrainianUruguayanUteVenezuelanVietnameseWelshWest IndianYakamaYaquiYugoslavianYumanYup'ikZimbabwean
Immigration
NonimmigrantsImmigrantsAfghanistanAfricaAlbaniaArgentinaArmeniaAsiaAustraliaAustriaBahamasBangladeshBarbadosBelarusBelgiumBelizeBoliviaBosnia and HerzegovinaBrazilBulgariaBurma/MyanmarCabo VerdeCambodiaCameroonCanadaCaribbeanCentral AmericaChileChinaColombiaCongoCosta RicaCroatiaCubaCzechoslovakiaDenmarkDominicaDominican RepublicEastern AfricaEastern AsiaEastern EuropeEcuadorEgyptEl SalvadorEnglandEritreaEthiopiaEuropeFijiFranceGhanaGreeceGrenadaGuatemalaGuyanaHaitiHondurasHong KongHungaryIndiaIndonesiaIranIraqIrelandIsraelItalyJamaicaJapanJordanKazakhstanKenyaKoreaKuwaitLaosLatin AmericaLatviaLebanonLiberiaLithuaniaMalaysiaMexicoMicronesiaMiddle AfricaMoldovaMoroccoNepalNetherlandsNicaraguaNigeriaNorth AmericaNorth MacedoniaNorthern AfricaNorthern EuropeNorwayOceaniaPakistanPanamaPeruPhilippinesPolandPortugalRomaniaRussiaSaudi ArabiaScotlandSenegalSerbiaSierra LeoneSingaporeSomaliaSouth AfricaSouth AmericaSouth Central AsiaSouth Eastern AsiaSouthern EuropeSpainSri LankaSt. Vincent and the GrenadinesSudanSwedenSwitzerlandSyriaTaiwanThailandTrinidad and TobagoTurkeyUgandaUkraineUruguayUzbekistanVenezuelaVietnamWest IndiesWestern AfricaWestern AsiaWestern EuropeYemenZaireZimbabweAzores
Immigrants from Germany
Race
Ancestry
AfghanAfricanAlaska NativeAlaskan AthabascanAlbanianAleutAlsatianAmericanApacheArabArapahoArgentineanArmenianAssyrian/Chaldean/SyriacAustralianAustrianBahamianBangladeshiBarbadianBasqueBelgianBelizeanBermudanBhutaneseBlackfeetBolivianBrazilianBritishBritish West IndianBulgarianBurmeseCajunCambodianCanadianCape VerdeanCarpatho RusynCelticCentral AmericanCentral American IndianCherokeeCheyenneChickasawChileanChineseChippewaChoctawColombianColvilleComancheCosta RicanCreeCreekCroatianCrowCubanCypriotCzechCzechoslovakianDanishDelawareDominicanDutchDutch West IndianEastern EuropeanEcuadorianEgyptianEnglishEstonianEthiopianEuropeanFijianFilipinoFinnishFrenchFrench American IndianFrench CanadianGermanGerman RussianGhanaianGreekGuamanian/ChamorroGuatemalanGuyaneseHaitianHmongHonduranHopiHoumaHungarianIcelanderIndian (Asian)IndonesianInupiatIranianIraqiIrishIroquoisIsraeliItalianJamaicanJapaneseJordanianKenyanKiowaKoreanLaotianLatvianLebaneseLiberianLithuanianLumbeeLuxembourgerMacedonianMalaysianMalteseMarshalleseMenomineeMexicanMexican American IndianMongolianMoroccanNative HawaiianNavajoNepaleseNew ZealanderNicaraguanNigerianNorthern EuropeanNorwegianOkinawanOsageOttawaPaiutePakistaniPalestinianPanamanianParaguayanPennsylvania GermanPeruvianPimaPolishPortuguesePotawatomiPuebloPuerto RicanPuget Sound SalishRomanianRussianSalvadoranSamoanScandinavianScotch-IrishScottishSeminoleSenegaleseSerbianShoshoneSierra LeoneanSiouxSlavicSlovakSloveneSomaliSouth AfricanSouth AmericanSouth American IndianSoviet UnionSpaniardSpanishSpanish AmericanSpanish American IndianSri LankanSubsaharan AfricanSudaneseSwedishSwissSyrianTaiwaneseThaiTlingit-HaidaTohono O'OdhamTonganTrinidadian and TobagonianTsimshianTurkishU.S. Virgin IslanderUgandanUkrainianUruguayanUteVenezuelanVietnameseWelshWest IndianYakamaYaquiYugoslavianYumanYup'ikZimbabwean
Immigration
NonimmigrantsImmigrantsAfghanistanAfricaAlbaniaArgentinaArmeniaAsiaAustraliaAustriaBahamasBangladeshBarbadosBelarusBelgiumBelizeBoliviaBosnia and HerzegovinaBrazilBulgariaBurma/MyanmarCabo VerdeCambodiaCameroonCanadaCaribbeanCentral AmericaChileChinaColombiaCongoCosta RicaCroatiaCubaCzechoslovakiaDenmarkDominicaDominican RepublicEastern AfricaEastern AsiaEastern EuropeEcuadorEgyptEl SalvadorEnglandEritreaEthiopiaEuropeFijiFranceGermanyGhanaGreeceGrenadaGuatemalaGuyanaHaitiHondurasHong KongHungaryIndiaIndonesiaIranIraqIrelandIsraelItalyJamaicaJapanJordanKazakhstanKenyaKoreaKuwaitLaosLatin AmericaLatviaLebanonLiberiaLithuaniaMalaysiaMexicoMicronesiaMiddle AfricaMoldovaMoroccoNepalNetherlandsNicaraguaNigeriaNorth AmericaNorth MacedoniaNorthern AfricaNorthern EuropeNorwayOceaniaPakistanPanamaPeruPhilippinesPolandPortugalRomaniaRussiaSaudi ArabiaScotlandSenegalSerbiaSierra LeoneSingaporeSomaliaSouth AfricaSouth AmericaSouth Central AsiaSouth Eastern AsiaSpainSri LankaSt. Vincent and the GrenadinesSudanSwedenSwitzerlandSyriaTaiwanThailandTrinidad and TobagoTurkeyUgandaUkraineUruguayUzbekistanVenezuelaVietnamWest IndiesWestern AfricaWestern AsiaWestern EuropeYemenZaireZimbabweAzores
Child Poverty Under the Age of 16
Income
Poverty
Unemployment
Labor Participation
Family Structure
Vehicle Availability
Education Level
Disability

Child Poverty Under the Age of 16 Comparison

Immigrants from Southern Europe

Immigrants from Germany

Excellent
Good
15.1%
CHILD POVERTY UNDER THE AGE OF 16
89.7/ 100
METRIC RATING
129th/ 347
METRIC RANK
15.8%
CHILD POVERTY UNDER THE AGE OF 16
67.3/ 100
METRIC RATING
164th/ 347
METRIC RANK

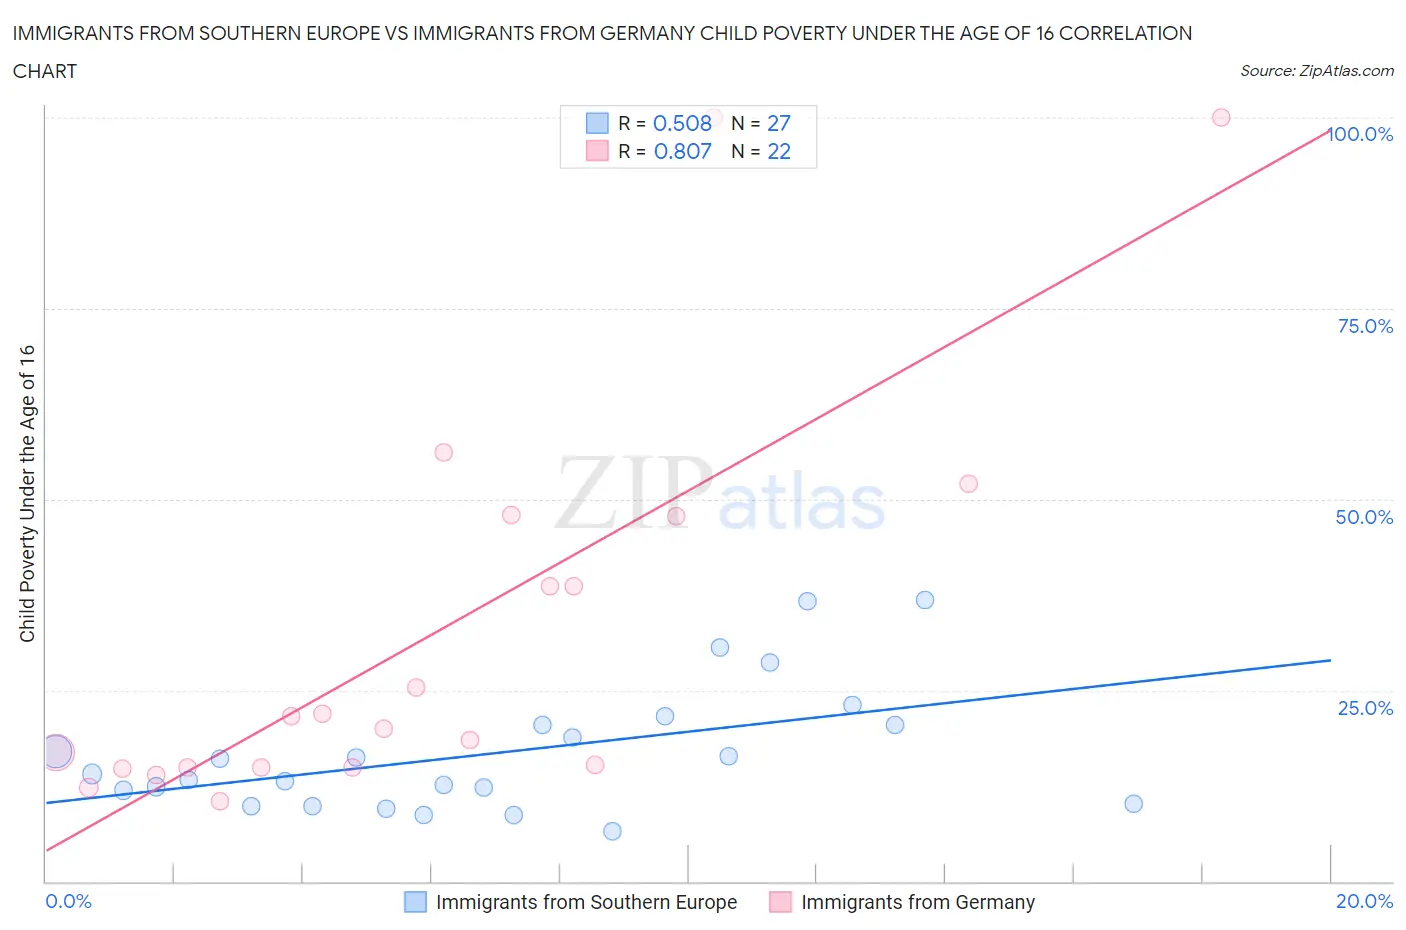
Immigrants from Southern Europe vs Immigrants from Germany Child Poverty Under the Age of 16 Correlation Chart

The statistical analysis conducted on geographies consisting of 397,776,906 people shows a substantial positive correlation between the proportion of Immigrants from Southern Europe and poverty level among children under the age of 16 in the United States with a correlation coefficient (R) of 0.508 and weighted average of 15.1%. Similarly, the statistical analysis conducted on geographies consisting of 458,231,020 people shows a very strong positive correlation between the proportion of Immigrants from Germany and poverty level among children under the age of 16 in the United States with a correlation coefficient (R) of 0.807 and weighted average of 15.8%, a difference of 4.6%.
Immigrants from Southern Europe vs Immigrants from Germany Child Poverty Under the Age of 16

Child Poverty Under the Age of 16 Correlation Summary

MeasurementImmigrants from Southern EuropeImmigrants from Germany
Minimum6.5%10.5%
Maximum36.8%100.0%
Range30.3%89.5%
Mean16.9%32.6%
Median14.1%20.8%
Interquartile 25% (IQ1)10.1%14.9%
Interquartile 75% (IQ3)20.4%47.8%
Interquartile Range (IQR)10.3%32.9%
Standard Deviation (Sample)8.3%26.1%
Standard Deviation (Population)8.1%25.5%

Similar Demographics by Child Poverty Under the Age of 16

Demographics Similar to Immigrants from Southern Europe by Child Poverty Under the Age of 16

In terms of child poverty under the age of 16, the demographic groups most similar to Immigrants from Southern Europe are Mongolian (15.2%, a difference of 0.10%), Armenian (15.2%, a difference of 0.12%), Immigrants from Kazakhstan (15.1%, a difference of 0.15%), Immigrants from Western Europe (15.1%, a difference of 0.21%), and Canadian (15.2%, a difference of 0.22%).
DemographicsRating | RankChild Poverty Under the Age of 16
Pakistanis
91.7
/100
|
#122
Exceptional
15.0%
Immigrants | Brazil
91.1
/100
|
#123
Exceptional
15.1%
Czechoslovakians
91.0
/100
|
#124
Exceptional
15.1%
Palestinians
90.9
/100
|
#125
Exceptional
15.1%
Portuguese
90.6
/100
|
#126
Exceptional
15.1%
Immigrants | Western Europe
90.3
/100
|
#127
Exceptional
15.1%
Immigrants | Kazakhstan
90.2
/100
|
#128
Exceptional
15.1%
Immigrants | Southern Europe
89.7
/100
|
#129
Excellent
15.1%
Mongolians
89.5
/100
|
#130
Excellent
15.2%
Armenians
89.4
/100
|
#131
Excellent
15.2%
Canadians
89.1
/100
|
#132
Excellent
15.2%
Immigrants | South Eastern Asia
89.0
/100
|
#133
Excellent
15.2%
Native Hawaiians
88.7
/100
|
#134
Excellent
15.2%
Albanians
88.6
/100
|
#135
Excellent
15.2%
Immigrants | Spain
87.3
/100
|
#136
Excellent
15.3%

Demographics Similar to Immigrants from Germany by Child Poverty Under the Age of 16

In terms of child poverty under the age of 16, the demographic groups most similar to Immigrants from Germany are Colombian (15.8%, a difference of 0.040%), Yugoslavian (15.8%, a difference of 0.040%), Immigrants from Northern Africa (15.8%, a difference of 0.10%), Guamanian/Chamorro (15.9%, a difference of 0.13%), and Immigrants from Oceania (15.9%, a difference of 0.27%).
DemographicsRating | RankChild Poverty Under the Age of 16
Immigrants | Nepal
72.9
/100
|
#157
Good
15.7%
Immigrants | Chile
72.8
/100
|
#158
Good
15.7%
Immigrants | Fiji
71.1
/100
|
#159
Good
15.8%
Immigrants | Albania
70.7
/100
|
#160
Good
15.8%
Immigrants | Northern Africa
68.1
/100
|
#161
Good
15.8%
Colombians
67.6
/100
|
#162
Good
15.8%
Yugoslavians
67.6
/100
|
#163
Good
15.8%
Immigrants | Germany
67.3
/100
|
#164
Good
15.8%
Guamanians/Chamorros
66.4
/100
|
#165
Good
15.9%
Immigrants | Oceania
65.4
/100
|
#166
Good
15.9%
Costa Ricans
61.1
/100
|
#167
Good
16.0%
South Americans
57.9
/100
|
#168
Average
16.0%
Uruguayans
54.7
/100
|
#169
Average
16.1%
Immigrants | Colombia
54.4
/100
|
#170
Average
16.1%
Hungarians
52.5
/100
|
#171
Average
16.2%