Immigrants from Turkey vs Immigrants from Jamaica Child Poverty Under the Age of 16
COMPARE
Immigrants from Turkey
Immigrants from Jamaica
Child Poverty Under the Age of 16
Child Poverty Under the Age of 16 Comparison
Immigrants from Turkey
Immigrants from Jamaica
14.4%
CHILD POVERTY UNDER THE AGE OF 16
97.6/ 100
METRIC RATING
73rd/ 347
METRIC RANK
19.8%
CHILD POVERTY UNDER THE AGE OF 16
0.1/ 100
METRIC RATING
273rd/ 347
METRIC RANK
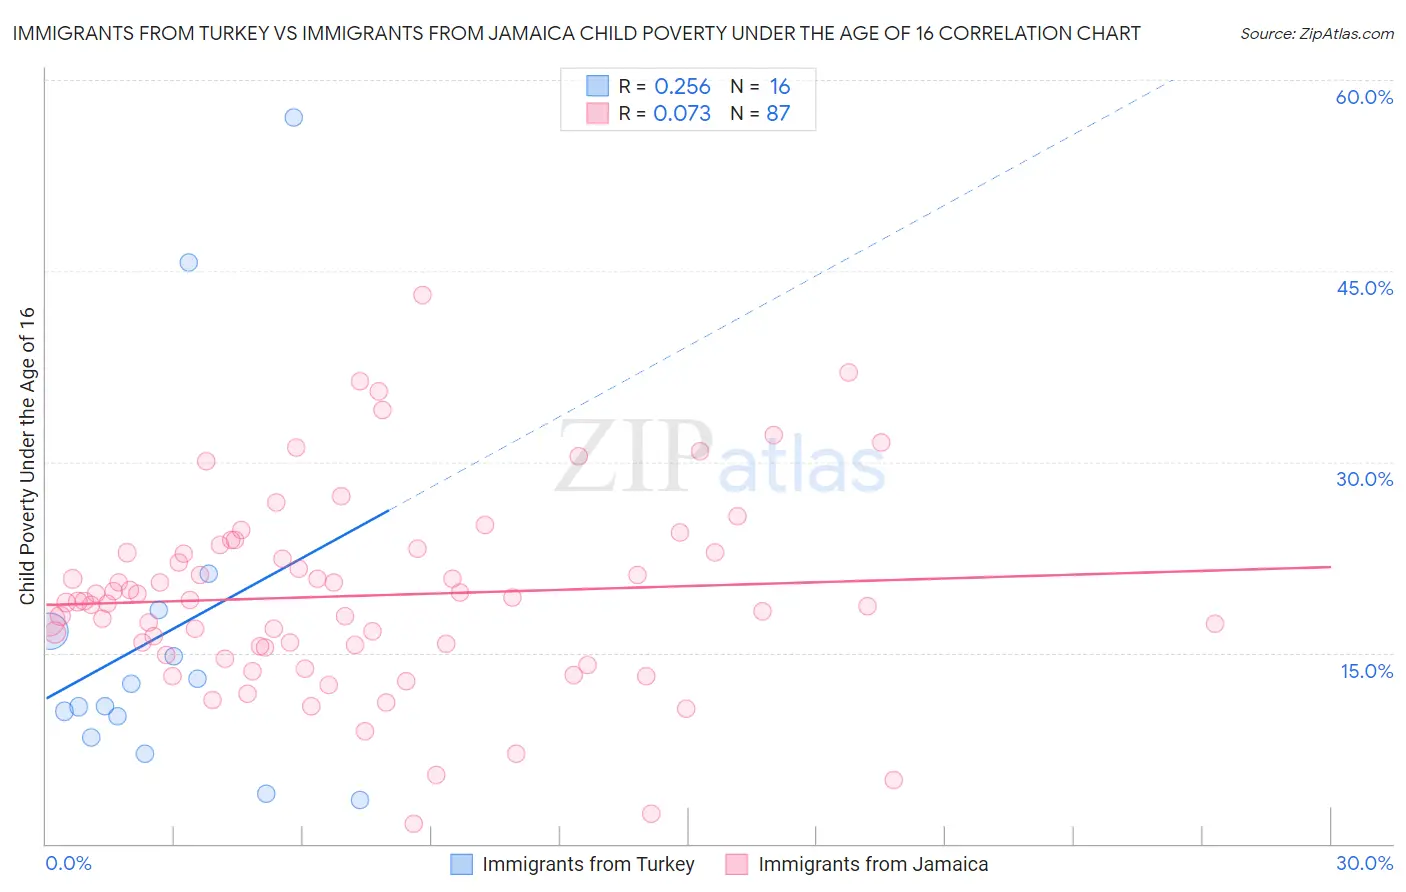
Immigrants from Turkey vs Immigrants from Jamaica Child Poverty Under the Age of 16 Correlation Chart
The statistical analysis conducted on geographies consisting of 221,622,617 people shows a weak positive correlation between the proportion of Immigrants from Turkey and poverty level among children under the age of 16 in the United States with a correlation coefficient (R) of 0.256 and weighted average of 14.4%. Similarly, the statistical analysis conducted on geographies consisting of 299,947,677 people shows a slight positive correlation between the proportion of Immigrants from Jamaica and poverty level among children under the age of 16 in the United States with a correlation coefficient (R) of 0.073 and weighted average of 19.8%, a difference of 37.7%.
Child Poverty Under the Age of 16 Correlation Summary
| Measurement | Immigrants from Turkey | Immigrants from Jamaica |
| Minimum | 3.5% | 1.6% |
| Maximum | 57.0% | 43.2% |
| Range | 53.6% | 41.6% |
| Mean | 16.5% | 19.5% |
| Median | 11.7% | 19.0% |
| Interquartile 25% (IQ1) | 9.2% | 15.4% |
| Interquartile 75% (IQ3) | 17.6% | 22.9% |
| Interquartile Range (IQR) | 8.4% | 7.5% |
| Standard Deviation (Sample) | 14.6% | 7.6% |
| Standard Deviation (Population) | 14.1% | 7.5% |
Similar Demographics by Child Poverty Under the Age of 16
Demographics Similar to Immigrants from Turkey by Child Poverty Under the Age of 16
In terms of child poverty under the age of 16, the demographic groups most similar to Immigrants from Turkey are Macedonian (14.4%, a difference of 0.0%), Cambodian (14.4%, a difference of 0.21%), Ukrainian (14.4%, a difference of 0.21%), Immigrants from Eastern Europe (14.4%, a difference of 0.21%), and Australian (14.4%, a difference of 0.25%).
| Demographics | Rating | Rank | Child Poverty Under the Age of 16 |
| Slovenes | 98.1 /100 | #66 | Exceptional 14.3% |
| Europeans | 98.1 /100 | #67 | Exceptional 14.3% |
| Laotians | 98.0 /100 | #68 | Exceptional 14.3% |
| Immigrants | Bulgaria | 98.0 /100 | #69 | Exceptional 14.3% |
| Immigrants | Netherlands | 97.9 /100 | #70 | Exceptional 14.3% |
| Immigrants | Poland | 97.9 /100 | #71 | Exceptional 14.3% |
| Cambodians | 97.8 /100 | #72 | Exceptional 14.4% |
| Immigrants | Turkey | 97.6 /100 | #73 | Exceptional 14.4% |
| Macedonians | 97.6 /100 | #74 | Exceptional 14.4% |
| Ukrainians | 97.5 /100 | #75 | Exceptional 14.4% |
| Immigrants | Eastern Europe | 97.5 /100 | #76 | Exceptional 14.4% |
| Australians | 97.5 /100 | #77 | Exceptional 14.4% |
| Immigrants | Russia | 97.3 /100 | #78 | Exceptional 14.5% |
| Swiss | 97.3 /100 | #79 | Exceptional 14.5% |
| Immigrants | North Macedonia | 97.2 /100 | #80 | Exceptional 14.5% |
Demographics Similar to Immigrants from Jamaica by Child Poverty Under the Age of 16
In terms of child poverty under the age of 16, the demographic groups most similar to Immigrants from Jamaica are Immigrants from Cabo Verde (19.9%, a difference of 0.15%), Immigrants from Barbados (19.9%, a difference of 0.16%), Belizean (19.9%, a difference of 0.16%), Immigrants from Bangladesh (19.8%, a difference of 0.24%), and Iroquois (19.9%, a difference of 0.30%).
| Demographics | Rating | Rank | Child Poverty Under the Age of 16 |
| Liberians | 0.1 /100 | #266 | Tragic 19.5% |
| Cherokee | 0.1 /100 | #267 | Tragic 19.5% |
| Jamaicans | 0.1 /100 | #268 | Tragic 19.7% |
| Immigrants | El Salvador | 0.1 /100 | #269 | Tragic 19.7% |
| Spanish American Indians | 0.1 /100 | #270 | Tragic 19.7% |
| Immigrants | Liberia | 0.1 /100 | #271 | Tragic 19.7% |
| Immigrants | Bangladesh | 0.1 /100 | #272 | Tragic 19.8% |
| Immigrants | Jamaica | 0.1 /100 | #273 | Tragic 19.8% |
| Immigrants | Cabo Verde | 0.1 /100 | #274 | Tragic 19.9% |
| Immigrants | Barbados | 0.1 /100 | #275 | Tragic 19.9% |
| Belizeans | 0.1 /100 | #276 | Tragic 19.9% |
| Iroquois | 0.1 /100 | #277 | Tragic 19.9% |
| Bangladeshis | 0.0 /100 | #278 | Tragic 19.9% |
| Sub-Saharan Africans | 0.0 /100 | #279 | Tragic 19.9% |
| Comanche | 0.0 /100 | #280 | Tragic 19.9% |