Salvadoran vs Immigrants from Jamaica Child Poverty Under the Age of 16
COMPARE
Salvadoran
Immigrants from Jamaica
Child Poverty Under the Age of 16
Child Poverty Under the Age of 16 Comparison
Salvadorans
Immigrants from Jamaica
19.1%
CHILD POVERTY UNDER THE AGE OF 16
0.3/ 100
METRIC RATING
253rd/ 347
METRIC RANK
19.8%
CHILD POVERTY UNDER THE AGE OF 16
0.1/ 100
METRIC RATING
273rd/ 347
METRIC RANK
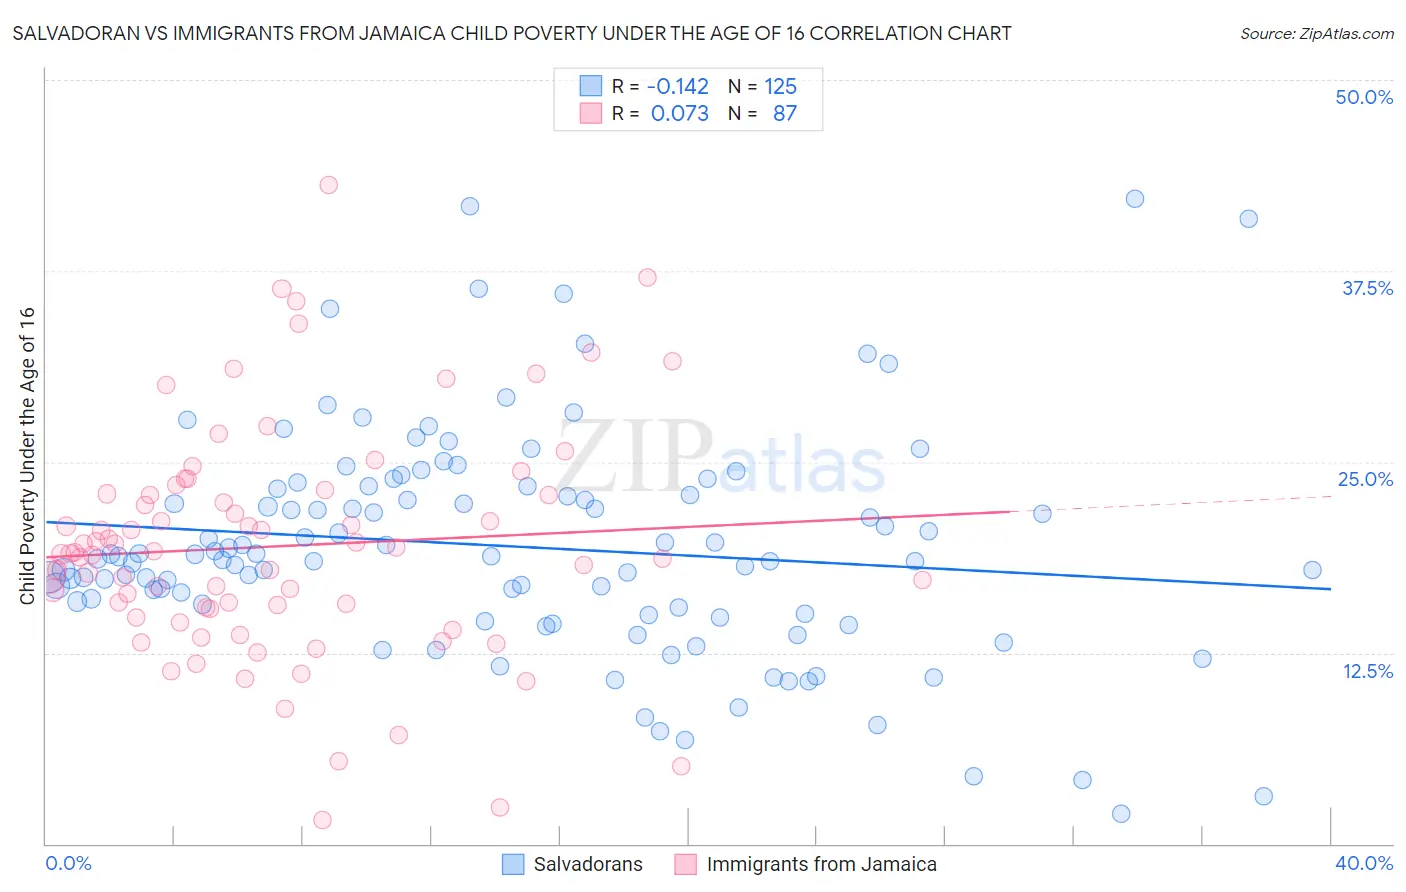
Salvadoran vs Immigrants from Jamaica Child Poverty Under the Age of 16 Correlation Chart
The statistical analysis conducted on geographies consisting of 396,509,971 people shows a poor negative correlation between the proportion of Salvadorans and poverty level among children under the age of 16 in the United States with a correlation coefficient (R) of -0.142 and weighted average of 19.1%. Similarly, the statistical analysis conducted on geographies consisting of 299,947,677 people shows a slight positive correlation between the proportion of Immigrants from Jamaica and poverty level among children under the age of 16 in the United States with a correlation coefficient (R) of 0.073 and weighted average of 19.8%, a difference of 3.7%.
Child Poverty Under the Age of 16 Correlation Summary
| Measurement | Salvadoran | Immigrants from Jamaica |
| Minimum | 1.9% | 1.6% |
| Maximum | 42.2% | 43.2% |
| Range | 40.3% | 41.6% |
| Mean | 19.5% | 19.5% |
| Median | 18.8% | 19.0% |
| Interquartile 25% (IQ1) | 15.2% | 15.4% |
| Interquartile 75% (IQ3) | 23.3% | 22.9% |
| Interquartile Range (IQR) | 8.1% | 7.5% |
| Standard Deviation (Sample) | 7.4% | 7.6% |
| Standard Deviation (Population) | 7.3% | 7.5% |
Demographics Similar to Salvadorans and Immigrants from Jamaica by Child Poverty Under the Age of 16
In terms of child poverty under the age of 16, the demographic groups most similar to Salvadorans are Immigrants from Western Africa (19.2%, a difference of 0.25%), Trinidadian and Tobagonian (19.2%, a difference of 0.42%), Inupiat (19.2%, a difference of 0.50%), Ottawa (19.2%, a difference of 0.52%), and Spanish American (19.2%, a difference of 0.60%). Similarly, the demographic groups most similar to Immigrants from Jamaica are Immigrants from Bangladesh (19.8%, a difference of 0.24%), Immigrants from Liberia (19.7%, a difference of 0.54%), Spanish American Indian (19.7%, a difference of 0.67%), Immigrants from El Salvador (19.7%, a difference of 0.69%), and Jamaican (19.7%, a difference of 0.75%).
| Demographics | Rating | Rank | Child Poverty Under the Age of 16 |
| Salvadorans | 0.3 /100 | #253 | Tragic 19.1% |
| Immigrants | Western Africa | 0.2 /100 | #254 | Tragic 19.2% |
| Trinidadians and Tobagonians | 0.2 /100 | #255 | Tragic 19.2% |
| Inupiat | 0.2 /100 | #256 | Tragic 19.2% |
| Ottawa | 0.2 /100 | #257 | Tragic 19.2% |
| Spanish Americans | 0.2 /100 | #258 | Tragic 19.2% |
| Mexican American Indians | 0.2 /100 | #259 | Tragic 19.3% |
| Guyanese | 0.2 /100 | #260 | Tragic 19.3% |
| Immigrants | Burma/Myanmar | 0.1 /100 | #261 | Tragic 19.4% |
| Immigrants | Guyana | 0.1 /100 | #262 | Tragic 19.4% |
| Vietnamese | 0.1 /100 | #263 | Tragic 19.4% |
| Immigrants | Ecuador | 0.1 /100 | #264 | Tragic 19.4% |
| Chickasaw | 0.1 /100 | #265 | Tragic 19.5% |
| Liberians | 0.1 /100 | #266 | Tragic 19.5% |
| Cherokee | 0.1 /100 | #267 | Tragic 19.5% |
| Jamaicans | 0.1 /100 | #268 | Tragic 19.7% |
| Immigrants | El Salvador | 0.1 /100 | #269 | Tragic 19.7% |
| Spanish American Indians | 0.1 /100 | #270 | Tragic 19.7% |
| Immigrants | Liberia | 0.1 /100 | #271 | Tragic 19.7% |
| Immigrants | Bangladesh | 0.1 /100 | #272 | Tragic 19.8% |
| Immigrants | Jamaica | 0.1 /100 | #273 | Tragic 19.8% |