Immigrants from South Africa vs Canadian Female Poverty
COMPARE
Immigrants from South Africa
Canadian
Female Poverty
Female Poverty Comparison
Immigrants from South Africa
Canadians
12.5%
FEMALE POVERTY
95.4/ 100
METRIC RATING
95th/ 347
METRIC RANK
12.7%
FEMALE POVERTY
92.0/ 100
METRIC RATING
113th/ 347
METRIC RANK
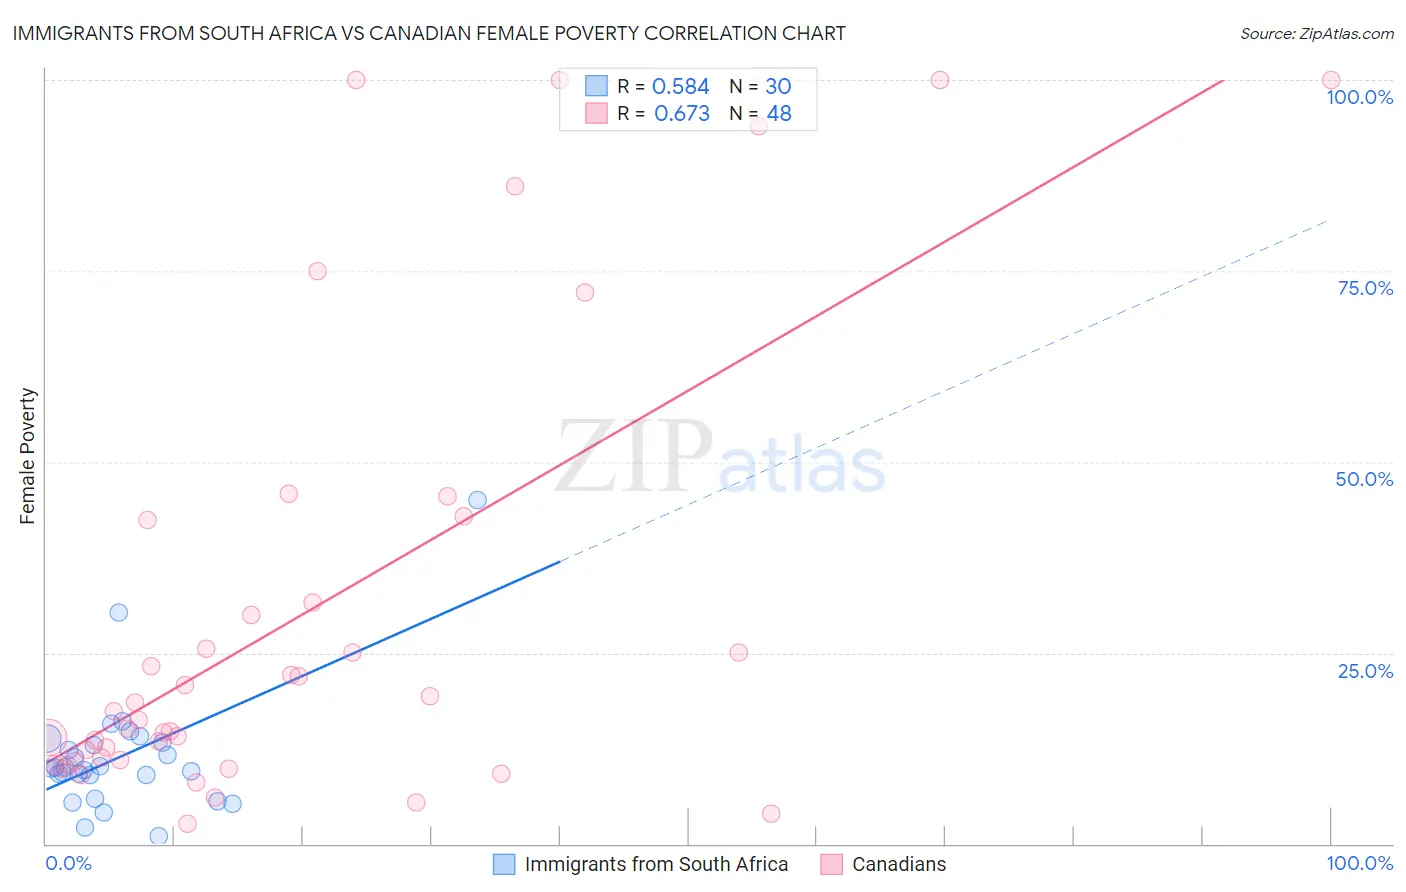
Immigrants from South Africa vs Canadian Female Poverty Correlation Chart
The statistical analysis conducted on geographies consisting of 233,245,302 people shows a substantial positive correlation between the proportion of Immigrants from South Africa and poverty level among females in the United States with a correlation coefficient (R) of 0.584 and weighted average of 12.5%. Similarly, the statistical analysis conducted on geographies consisting of 437,154,651 people shows a significant positive correlation between the proportion of Canadians and poverty level among females in the United States with a correlation coefficient (R) of 0.673 and weighted average of 12.7%, a difference of 1.5%.
Female Poverty Correlation Summary
| Measurement | Immigrants from South Africa | Canadian |
| Minimum | 0.91% | 2.7% |
| Maximum | 44.9% | 100.0% |
| Range | 44.0% | 97.3% |
| Mean | 11.5% | 30.0% |
| Median | 9.9% | 16.8% |
| Interquartile 25% (IQ1) | 8.9% | 10.9% |
| Interquartile 75% (IQ3) | 13.2% | 37.0% |
| Interquartile Range (IQR) | 4.3% | 26.0% |
| Standard Deviation (Sample) | 8.3% | 29.7% |
| Standard Deviation (Population) | 8.1% | 29.4% |
Demographics Similar to Immigrants from South Africa and Canadians by Female Poverty
In terms of female poverty, the demographic groups most similar to Immigrants from South Africa are Immigrants from Indonesia (12.5%, a difference of 0.040%), British (12.5%, a difference of 0.070%), Australian (12.5%, a difference of 0.10%), Native Hawaiian (12.5%, a difference of 0.13%), and Romanian (12.5%, a difference of 0.15%). Similarly, the demographic groups most similar to Canadians are Immigrants from Israel (12.6%, a difference of 0.030%), Welsh (12.7%, a difference of 0.12%), Soviet Union (12.6%, a difference of 0.17%), Paraguayan (12.6%, a difference of 0.39%), and Immigrants from Zimbabwe (12.6%, a difference of 0.42%).
| Demographics | Rating | Rank | Female Poverty |
| Immigrants | Indonesia | 95.4 /100 | #94 | Exceptional 12.5% |
| Immigrants | South Africa | 95.4 /100 | #95 | Exceptional 12.5% |
| British | 95.2 /100 | #96 | Exceptional 12.5% |
| Australians | 95.2 /100 | #97 | Exceptional 12.5% |
| Native Hawaiians | 95.1 /100 | #98 | Exceptional 12.5% |
| Romanians | 95.1 /100 | #99 | Exceptional 12.5% |
| Immigrants | Latvia | 94.8 /100 | #100 | Exceptional 12.5% |
| Tlingit-Haida | 94.8 /100 | #101 | Exceptional 12.5% |
| Immigrants | China | 94.5 /100 | #102 | Exceptional 12.5% |
| Slavs | 94.5 /100 | #103 | Exceptional 12.5% |
| Palestinians | 94.3 /100 | #104 | Exceptional 12.5% |
| Scottish | 94.1 /100 | #105 | Exceptional 12.5% |
| Immigrants | Turkey | 93.8 /100 | #106 | Exceptional 12.6% |
| Laotians | 93.4 /100 | #107 | Exceptional 12.6% |
| Portuguese | 93.1 /100 | #108 | Exceptional 12.6% |
| Immigrants | Zimbabwe | 93.1 /100 | #109 | Exceptional 12.6% |
| Paraguayans | 93.0 /100 | #110 | Exceptional 12.6% |
| Soviet Union | 92.4 /100 | #111 | Exceptional 12.6% |
| Immigrants | Israel | 92.0 /100 | #112 | Exceptional 12.6% |
| Canadians | 92.0 /100 | #113 | Exceptional 12.7% |
| Welsh | 91.6 /100 | #114 | Exceptional 12.7% |