Immigrants from South Africa vs Fijian Single Father Poverty
COMPARE
Immigrants from South Africa
Fijian
Single Father Poverty
Single Father Poverty Comparison
Immigrants from South Africa
Fijians
16.3%
SINGLE FATHER POVERTY
44.2/ 100
METRIC RATING
177th/ 347
METRIC RANK
15.7%
SINGLE FATHER POVERTY
96.8/ 100
METRIC RATING
101st/ 347
METRIC RANK
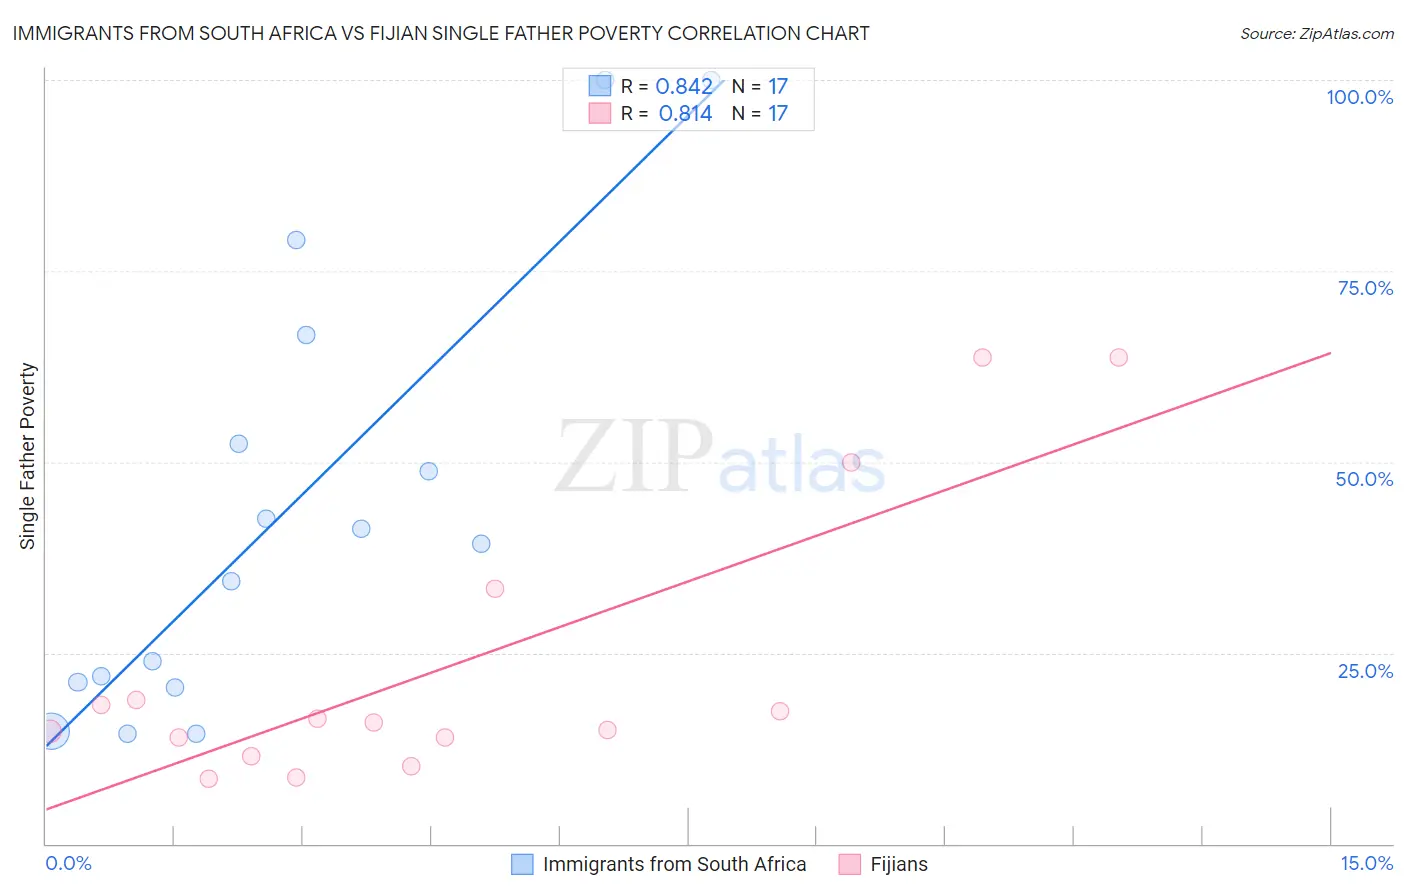
Immigrants from South Africa vs Fijian Single Father Poverty Correlation Chart
The statistical analysis conducted on geographies consisting of 189,025,953 people shows a very strong positive correlation between the proportion of Immigrants from South Africa and poverty level among single fathers in the United States with a correlation coefficient (R) of 0.842 and weighted average of 16.3%. Similarly, the statistical analysis conducted on geographies consisting of 52,243,042 people shows a very strong positive correlation between the proportion of Fijians and poverty level among single fathers in the United States with a correlation coefficient (R) of 0.814 and weighted average of 15.7%, a difference of 4.2%.
Single Father Poverty Correlation Summary
| Measurement | Immigrants from South Africa | Fijian |
| Minimum | 14.4% | 8.5% |
| Maximum | 100.0% | 63.6% |
| Range | 85.6% | 55.2% |
| Mean | 43.2% | 23.1% |
| Median | 39.3% | 15.9% |
| Interquartile 25% (IQ1) | 20.8% | 12.7% |
| Interquartile 75% (IQ3) | 59.5% | 26.1% |
| Interquartile Range (IQR) | 38.7% | 13.4% |
| Standard Deviation (Sample) | 28.3% | 18.2% |
| Standard Deviation (Population) | 27.4% | 17.7% |
Similar Demographics by Single Father Poverty
Demographics Similar to Immigrants from South Africa by Single Father Poverty
In terms of single father poverty, the demographic groups most similar to Immigrants from South Africa are Immigrants from Cuba (16.4%, a difference of 0.12%), Serbian (16.4%, a difference of 0.15%), Vietnamese (16.3%, a difference of 0.17%), Immigrants from Ecuador (16.3%, a difference of 0.24%), and Immigrants from Sierra Leone (16.3%, a difference of 0.26%).
| Demographics | Rating | Rank | Single Father Poverty |
| Scandinavians | 52.3 /100 | #170 | Average 16.3% |
| Immigrants | Morocco | 50.7 /100 | #171 | Average 16.3% |
| Immigrants | Sierra Leone | 50.1 /100 | #172 | Average 16.3% |
| Immigrants | St. Vincent and the Grenadines | 50.0 /100 | #173 | Average 16.3% |
| Swedes | 50.0 /100 | #174 | Average 16.3% |
| Immigrants | Ecuador | 49.7 /100 | #175 | Average 16.3% |
| Vietnamese | 48.0 /100 | #176 | Average 16.3% |
| Immigrants | South Africa | 44.2 /100 | #177 | Average 16.3% |
| Immigrants | Cuba | 41.6 /100 | #178 | Average 16.4% |
| Serbians | 40.9 /100 | #179 | Average 16.4% |
| Immigrants | Latin America | 37.2 /100 | #180 | Fair 16.4% |
| Immigrants | Western Africa | 36.0 /100 | #181 | Fair 16.4% |
| Immigrants | Italy | 35.7 /100 | #182 | Fair 16.4% |
| Aleuts | 35.3 /100 | #183 | Fair 16.4% |
| Cambodians | 34.6 /100 | #184 | Fair 16.4% |
Demographics Similar to Fijians by Single Father Poverty
In terms of single father poverty, the demographic groups most similar to Fijians are Immigrants from Chile (15.7%, a difference of 0.030%), Chilean (15.7%, a difference of 0.16%), South American Indian (15.7%, a difference of 0.22%), Australian (15.7%, a difference of 0.24%), and Immigrants from Middle Africa (15.6%, a difference of 0.25%).
| Demographics | Rating | Rank | Single Father Poverty |
| Immigrants | Uruguay | 98.2 /100 | #94 | Exceptional 15.6% |
| Immigrants | Kazakhstan | 98.2 /100 | #95 | Exceptional 15.6% |
| Immigrants | Belgium | 98.1 /100 | #96 | Exceptional 15.6% |
| Yaqui | 98.1 /100 | #97 | Exceptional 15.6% |
| Zimbabweans | 98.1 /100 | #98 | Exceptional 15.6% |
| Immigrants | Middle Africa | 97.4 /100 | #99 | Exceptional 15.6% |
| Immigrants | Chile | 96.9 /100 | #100 | Exceptional 15.7% |
| Fijians | 96.8 /100 | #101 | Exceptional 15.7% |
| Chileans | 96.4 /100 | #102 | Exceptional 15.7% |
| South American Indians | 96.2 /100 | #103 | Exceptional 15.7% |
| Australians | 96.1 /100 | #104 | Exceptional 15.7% |
| Immigrants | Australia | 96.1 /100 | #105 | Exceptional 15.7% |
| Immigrants | Poland | 95.8 /100 | #106 | Exceptional 15.7% |
| Native Hawaiians | 95.8 /100 | #107 | Exceptional 15.7% |
| Pakistanis | 95.7 /100 | #108 | Exceptional 15.7% |