Immigrants from Somalia vs Northern European Unemployment Among Ages 30 to 34 years
COMPARE
Immigrants from Somalia
Northern European
Unemployment Among Ages 30 to 34 years
Unemployment Among Ages 30 to 34 years Comparison
Immigrants from Somalia
Northern Europeans
5.1%
UNEMPLOYMENT AMONG AGES 30 TO 34 YEARS
97.1/ 100
METRIC RATING
60th/ 347
METRIC RANK
5.3%
UNEMPLOYMENT AMONG AGES 30 TO 34 YEARS
87.9/ 100
METRIC RATING
104th/ 347
METRIC RANK
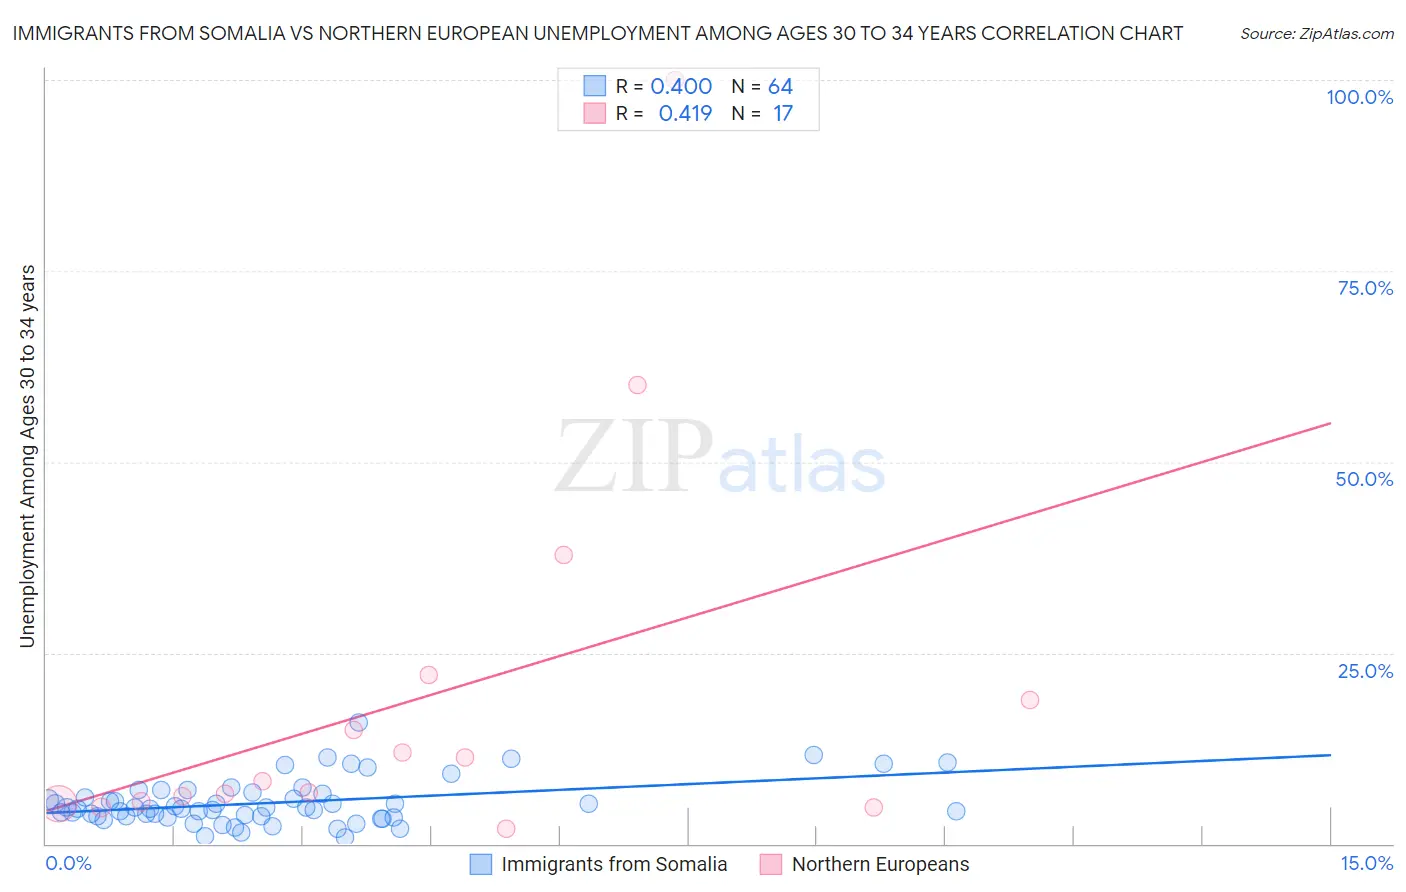
Immigrants from Somalia vs Northern European Unemployment Among Ages 30 to 34 years Correlation Chart
The statistical analysis conducted on geographies consisting of 91,234,330 people shows a moderate positive correlation between the proportion of Immigrants from Somalia and unemployment rate among population between the ages 30 and 34 in the United States with a correlation coefficient (R) of 0.400 and weighted average of 5.1%. Similarly, the statistical analysis conducted on geographies consisting of 375,306,906 people shows a moderate positive correlation between the proportion of Northern Europeans and unemployment rate among population between the ages 30 and 34 in the United States with a correlation coefficient (R) of 0.419 and weighted average of 5.3%, a difference of 2.8%.
Unemployment Among Ages 30 to 34 years Correlation Summary
| Measurement | Immigrants from Somalia | Northern European |
| Minimum | 0.90% | 1.9% |
| Maximum | 15.9% | 100.0% |
| Range | 15.0% | 98.1% |
| Mean | 5.4% | 19.2% |
| Median | 4.6% | 8.2% |
| Interquartile 25% (IQ1) | 3.5% | 5.4% |
| Interquartile 75% (IQ3) | 6.6% | 20.5% |
| Interquartile Range (IQR) | 3.0% | 15.1% |
| Standard Deviation (Sample) | 3.0% | 25.5% |
| Standard Deviation (Population) | 2.9% | 24.7% |
Similar Demographics by Unemployment Among Ages 30 to 34 years
Demographics Similar to Immigrants from Somalia by Unemployment Among Ages 30 to 34 years
In terms of unemployment among ages 30 to 34 years, the demographic groups most similar to Immigrants from Somalia are Swedish (5.1%, a difference of 0.010%), Indian (Asian) (5.1%, a difference of 0.030%), Immigrants from France (5.1%, a difference of 0.050%), Belgian (5.1%, a difference of 0.060%), and Immigrants from Eastern Asia (5.1%, a difference of 0.080%).
| Demographics | Rating | Rank | Unemployment Among Ages 30 to 34 years |
| Cubans | 98.1 /100 | #53 | Exceptional 5.1% |
| Immigrants | Morocco | 97.9 /100 | #54 | Exceptional 5.1% |
| Chinese | 97.7 /100 | #55 | Exceptional 5.1% |
| Immigrants | Serbia | 97.4 /100 | #56 | Exceptional 5.1% |
| Immigrants | China | 97.2 /100 | #57 | Exceptional 5.1% |
| Asians | 97.2 /100 | #58 | Exceptional 5.1% |
| Swedes | 97.1 /100 | #59 | Exceptional 5.1% |
| Immigrants | Somalia | 97.1 /100 | #60 | Exceptional 5.1% |
| Indians (Asian) | 97.0 /100 | #61 | Exceptional 5.1% |
| Immigrants | France | 97.0 /100 | #62 | Exceptional 5.1% |
| Belgians | 97.0 /100 | #63 | Exceptional 5.1% |
| Immigrants | Eastern Asia | 96.9 /100 | #64 | Exceptional 5.1% |
| Immigrants | Japan | 96.8 /100 | #65 | Exceptional 5.1% |
| Immigrants | Zimbabwe | 96.7 /100 | #66 | Exceptional 5.1% |
| Burmese | 96.5 /100 | #67 | Exceptional 5.1% |
Demographics Similar to Northern Europeans by Unemployment Among Ages 30 to 34 years
In terms of unemployment among ages 30 to 34 years, the demographic groups most similar to Northern Europeans are Argentinean (5.3%, a difference of 0.0%), Croatian (5.3%, a difference of 0.050%), Icelander (5.3%, a difference of 0.12%), Immigrants from Middle Africa (5.3%, a difference of 0.12%), and Immigrants from Jordan (5.3%, a difference of 0.16%).
| Demographics | Rating | Rank | Unemployment Among Ages 30 to 34 years |
| Europeans | 91.7 /100 | #97 | Exceptional 5.2% |
| Immigrants | North Macedonia | 90.9 /100 | #98 | Exceptional 5.2% |
| Immigrants | Ireland | 90.6 /100 | #99 | Exceptional 5.2% |
| Immigrants | Czechoslovakia | 89.5 /100 | #100 | Excellent 5.3% |
| British | 89.1 /100 | #101 | Excellent 5.3% |
| Immigrants | Switzerland | 88.8 /100 | #102 | Excellent 5.3% |
| Immigrants | Jordan | 88.8 /100 | #103 | Excellent 5.3% |
| Northern Europeans | 87.9 /100 | #104 | Excellent 5.3% |
| Argentineans | 87.9 /100 | #105 | Excellent 5.3% |
| Croatians | 87.6 /100 | #106 | Excellent 5.3% |
| Icelanders | 87.2 /100 | #107 | Excellent 5.3% |
| Immigrants | Middle Africa | 87.1 /100 | #108 | Excellent 5.3% |
| Immigrants | Chile | 86.7 /100 | #109 | Excellent 5.3% |
| Egyptians | 86.4 /100 | #110 | Excellent 5.3% |
| Immigrants | Pakistan | 86.2 /100 | #111 | Excellent 5.3% |