Immigrants from Somalia vs Immigrants from Ireland Female Poverty
COMPARE
Immigrants from Somalia
Immigrants from Ireland
Female Poverty
Female Poverty Comparison
Immigrants from Somalia
Immigrants from Ireland
17.0%
FEMALE POVERTY
0.0/ 100
METRIC RATING
312th/ 347
METRIC RANK
11.0%
FEMALE POVERTY
99.9/ 100
METRIC RATING
6th/ 347
METRIC RANK
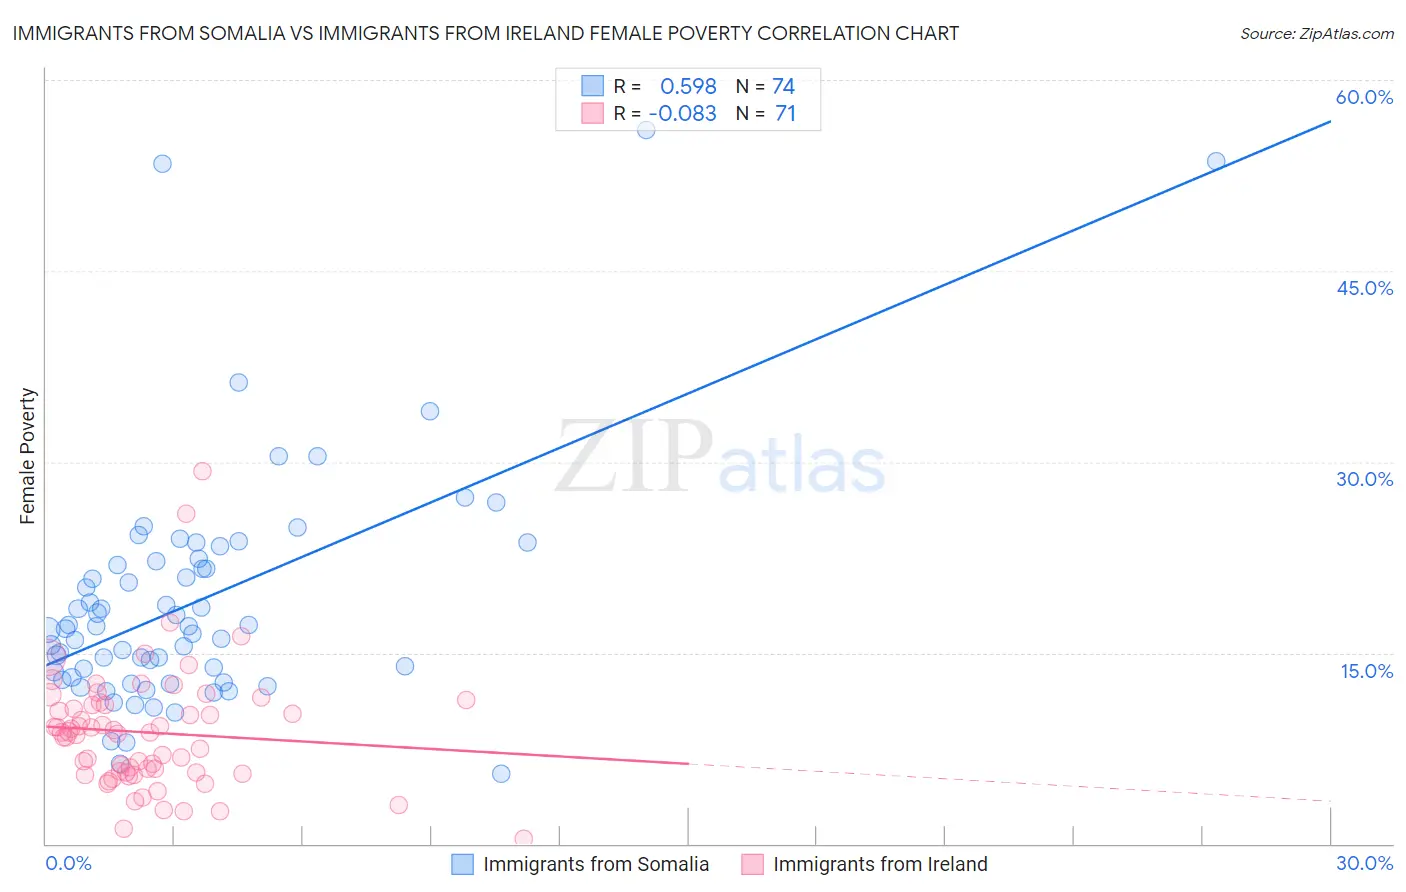
Immigrants from Somalia vs Immigrants from Ireland Female Poverty Correlation Chart
The statistical analysis conducted on geographies consisting of 92,101,870 people shows a substantial positive correlation between the proportion of Immigrants from Somalia and poverty level among females in the United States with a correlation coefficient (R) of 0.598 and weighted average of 17.0%. Similarly, the statistical analysis conducted on geographies consisting of 240,733,190 people shows a slight negative correlation between the proportion of Immigrants from Ireland and poverty level among females in the United States with a correlation coefficient (R) of -0.083 and weighted average of 11.0%, a difference of 54.8%.
Female Poverty Correlation Summary
| Measurement | Immigrants from Somalia | Immigrants from Ireland |
| Minimum | 5.5% | 0.42% |
| Maximum | 56.1% | 29.3% |
| Range | 50.6% | 28.9% |
| Mean | 19.1% | 8.7% |
| Median | 17.0% | 8.8% |
| Interquartile 25% (IQ1) | 13.1% | 5.6% |
| Interquartile 75% (IQ3) | 22.1% | 10.9% |
| Interquartile Range (IQR) | 9.1% | 5.3% |
| Standard Deviation (Sample) | 9.5% | 4.8% |
| Standard Deviation (Population) | 9.4% | 4.8% |
Similar Demographics by Female Poverty
Demographics Similar to Immigrants from Somalia by Female Poverty
In terms of female poverty, the demographic groups most similar to Immigrants from Somalia are British West Indian (17.0%, a difference of 0.080%), Immigrants from Guatemala (17.0%, a difference of 0.090%), Creek (17.0%, a difference of 0.10%), Dutch West Indian (17.1%, a difference of 0.33%), and Immigrants from Mexico (17.0%, a difference of 0.34%).
| Demographics | Rating | Rank | Female Poverty |
| Immigrants | Grenada | 0.0 /100 | #305 | Tragic 16.8% |
| Immigrants | Caribbean | 0.0 /100 | #306 | Tragic 16.9% |
| Seminole | 0.0 /100 | #307 | Tragic 16.9% |
| Africans | 0.0 /100 | #308 | Tragic 16.9% |
| Immigrants | Mexico | 0.0 /100 | #309 | Tragic 17.0% |
| Creek | 0.0 /100 | #310 | Tragic 17.0% |
| Immigrants | Guatemala | 0.0 /100 | #311 | Tragic 17.0% |
| Immigrants | Somalia | 0.0 /100 | #312 | Tragic 17.0% |
| British West Indians | 0.0 /100 | #313 | Tragic 17.0% |
| Dutch West Indians | 0.0 /100 | #314 | Tragic 17.1% |
| U.S. Virgin Islanders | 0.0 /100 | #315 | Tragic 17.3% |
| Hondurans | 0.0 /100 | #316 | Tragic 17.4% |
| Immigrants | Congo | 0.0 /100 | #317 | Tragic 17.4% |
| Ute | 0.0 /100 | #318 | Tragic 17.5% |
| Cajuns | 0.0 /100 | #319 | Tragic 17.5% |
Demographics Similar to Immigrants from Ireland by Female Poverty
In terms of female poverty, the demographic groups most similar to Immigrants from Ireland are Assyrian/Chaldean/Syriac (11.0%, a difference of 0.37%), Filipino (10.9%, a difference of 0.38%), Immigrants from South Central Asia (11.1%, a difference of 1.1%), Bulgarian (11.1%, a difference of 1.3%), and Immigrants from Hong Kong (11.2%, a difference of 2.1%).
| Demographics | Rating | Rank | Female Poverty |
| Immigrants | India | 100.0 /100 | #1 | Exceptional 9.9% |
| Chinese | 100.0 /100 | #2 | Exceptional 10.4% |
| Thais | 100.0 /100 | #3 | Exceptional 10.5% |
| Immigrants | Taiwan | 100.0 /100 | #4 | Exceptional 10.5% |
| Filipinos | 100.0 /100 | #5 | Exceptional 10.9% |
| Immigrants | Ireland | 99.9 /100 | #6 | Exceptional 11.0% |
| Assyrians/Chaldeans/Syriacs | 99.9 /100 | #7 | Exceptional 11.0% |
| Immigrants | South Central Asia | 99.9 /100 | #8 | Exceptional 11.1% |
| Bulgarians | 99.9 /100 | #9 | Exceptional 11.1% |
| Immigrants | Hong Kong | 99.9 /100 | #10 | Exceptional 11.2% |
| Maltese | 99.9 /100 | #11 | Exceptional 11.2% |
| Bhutanese | 99.9 /100 | #12 | Exceptional 11.3% |
| Immigrants | Lithuania | 99.9 /100 | #13 | Exceptional 11.3% |
| Lithuanians | 99.8 /100 | #14 | Exceptional 11.4% |
| Latvians | 99.8 /100 | #15 | Exceptional 11.4% |