Immigrants from Somalia vs Asian Child Poverty Among Girls Under 16
COMPARE
Immigrants from Somalia
Asian
Child Poverty Among Girls Under 16
Child Poverty Among Girls Under 16 Comparison
Immigrants from Somalia
Asians
21.6%
CHILD POVERTY AMONG GIRLS UNDER 16
0.0/ 100
METRIC RATING
310th/ 347
METRIC RANK
13.7%
CHILD POVERTY AMONG GIRLS UNDER 16
99.7/ 100
METRIC RATING
30th/ 347
METRIC RANK
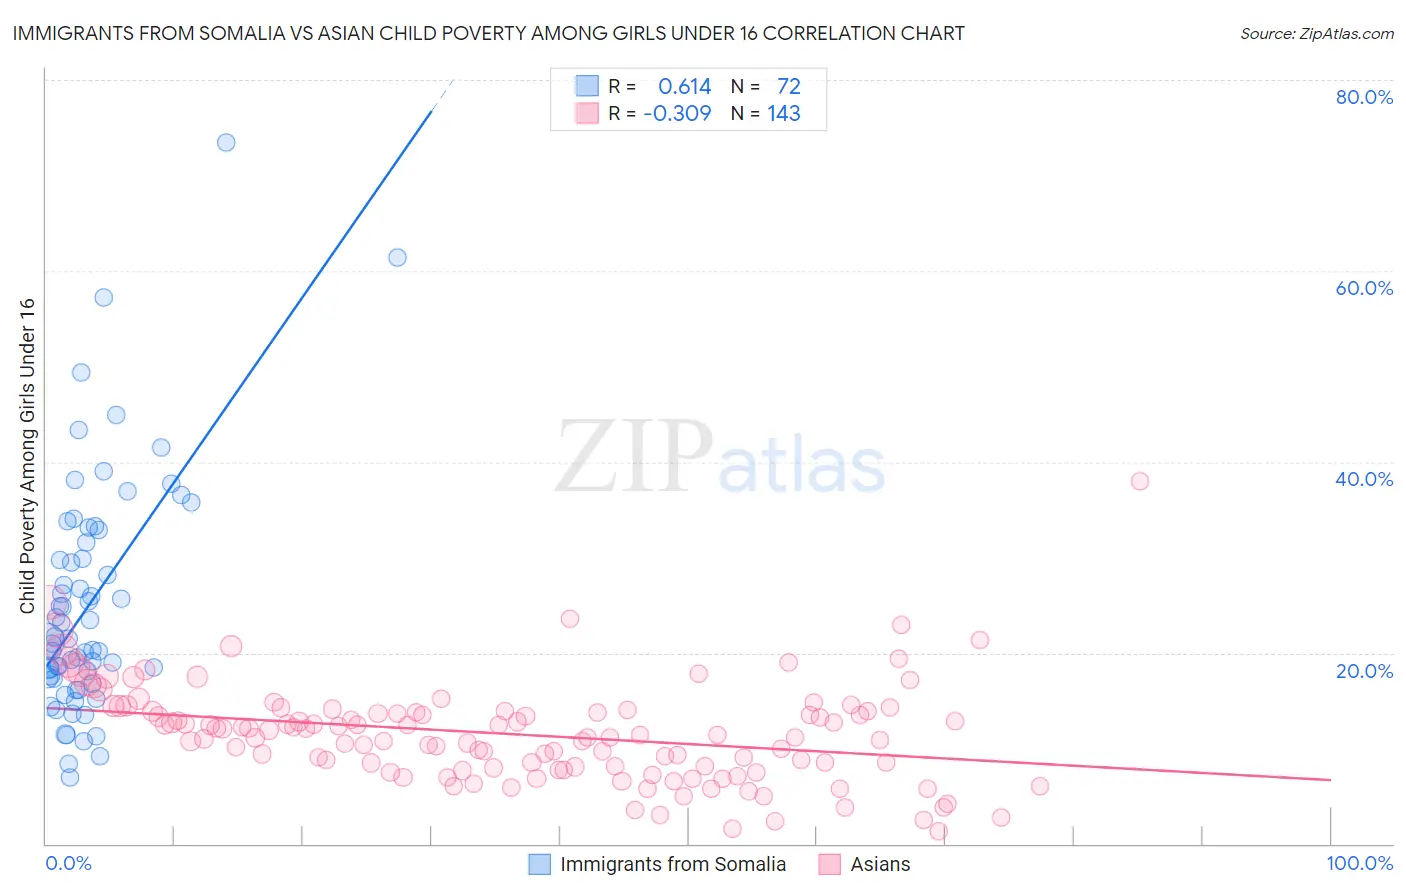
Immigrants from Somalia vs Asian Child Poverty Among Girls Under 16 Correlation Chart
The statistical analysis conducted on geographies consisting of 91,884,287 people shows a significant positive correlation between the proportion of Immigrants from Somalia and poverty level among girls under the age of 16 in the United States with a correlation coefficient (R) of 0.614 and weighted average of 21.6%. Similarly, the statistical analysis conducted on geographies consisting of 532,137,785 people shows a mild negative correlation between the proportion of Asians and poverty level among girls under the age of 16 in the United States with a correlation coefficient (R) of -0.309 and weighted average of 13.7%, a difference of 57.7%.
Child Poverty Among Girls Under 16 Correlation Summary
| Measurement | Immigrants from Somalia | Asian |
| Minimum | 6.9% | 1.3% |
| Maximum | 73.5% | 38.0% |
| Range | 66.6% | 36.7% |
| Mean | 25.2% | 11.5% |
| Median | 21.3% | 11.4% |
| Interquartile 25% (IQ1) | 17.4% | 8.0% |
| Interquartile 75% (IQ3) | 32.2% | 13.9% |
| Interquartile Range (IQR) | 14.8% | 5.9% |
| Standard Deviation (Sample) | 12.5% | 5.2% |
| Standard Deviation (Population) | 12.4% | 5.2% |
Similar Demographics by Child Poverty Among Girls Under 16
Demographics Similar to Immigrants from Somalia by Child Poverty Among Girls Under 16
In terms of child poverty among girls under 16, the demographic groups most similar to Immigrants from Somalia are Dutch West Indian (21.6%, a difference of 0.060%), Bahamian (21.5%, a difference of 0.27%), Immigrants from Mexico (21.6%, a difference of 0.29%), Houma (21.5%, a difference of 0.39%), and Immigrants from Bahamas (21.4%, a difference of 0.57%).
| Demographics | Rating | Rank | Child Poverty Among Girls Under 16 |
| British West Indians | 0.0 /100 | #303 | Tragic 21.3% |
| Indonesians | 0.0 /100 | #304 | Tragic 21.3% |
| Guatemalans | 0.0 /100 | #305 | Tragic 21.4% |
| Immigrants | Central America | 0.0 /100 | #306 | Tragic 21.4% |
| Immigrants | Bahamas | 0.0 /100 | #307 | Tragic 21.4% |
| Houma | 0.0 /100 | #308 | Tragic 21.5% |
| Bahamians | 0.0 /100 | #309 | Tragic 21.5% |
| Immigrants | Somalia | 0.0 /100 | #310 | Tragic 21.6% |
| Dutch West Indians | 0.0 /100 | #311 | Tragic 21.6% |
| Immigrants | Mexico | 0.0 /100 | #312 | Tragic 21.6% |
| Creek | 0.0 /100 | #313 | Tragic 21.7% |
| Arapaho | 0.0 /100 | #314 | Tragic 21.7% |
| Ute | 0.0 /100 | #315 | Tragic 21.8% |
| Immigrants | Guatemala | 0.0 /100 | #316 | Tragic 21.9% |
| Africans | 0.0 /100 | #317 | Tragic 21.9% |
Demographics Similar to Asians by Child Poverty Among Girls Under 16
In terms of child poverty among girls under 16, the demographic groups most similar to Asians are Turkish (13.7%, a difference of 0.12%), Danish (13.7%, a difference of 0.16%), Swedish (13.7%, a difference of 0.19%), Maltese (13.7%, a difference of 0.24%), and Bolivian (13.6%, a difference of 0.67%).
| Demographics | Rating | Rank | Child Poverty Among Girls Under 16 |
| Norwegians | 99.9 /100 | #23 | Exceptional 13.3% |
| Immigrants | Eastern Asia | 99.9 /100 | #24 | Exceptional 13.4% |
| Immigrants | China | 99.8 /100 | #25 | Exceptional 13.4% |
| Eastern Europeans | 99.8 /100 | #26 | Exceptional 13.5% |
| Latvians | 99.8 /100 | #27 | Exceptional 13.5% |
| Tongans | 99.8 /100 | #28 | Exceptional 13.6% |
| Bolivians | 99.8 /100 | #29 | Exceptional 13.6% |
| Asians | 99.7 /100 | #30 | Exceptional 13.7% |
| Turks | 99.7 /100 | #31 | Exceptional 13.7% |
| Danes | 99.7 /100 | #32 | Exceptional 13.7% |
| Swedes | 99.7 /100 | #33 | Exceptional 13.7% |
| Maltese | 99.7 /100 | #34 | Exceptional 13.7% |
| Immigrants | Northern Europe | 99.6 /100 | #35 | Exceptional 13.8% |
| Russians | 99.6 /100 | #36 | Exceptional 13.9% |
| Lithuanians | 99.6 /100 | #37 | Exceptional 13.9% |