Immigrants from Somalia vs Immigrants from Cabo Verde Child Poverty Among Girls Under 16
COMPARE
Immigrants from Somalia
Immigrants from Cabo Verde
Child Poverty Among Girls Under 16
Child Poverty Among Girls Under 16 Comparison
Immigrants from Somalia
Immigrants from Cabo Verde
21.6%
CHILD POVERTY AMONG GIRLS UNDER 16
0.0/ 100
METRIC RATING
310th/ 347
METRIC RANK
20.3%
CHILD POVERTY AMONG GIRLS UNDER 16
0.0/ 100
METRIC RATING
285th/ 347
METRIC RANK
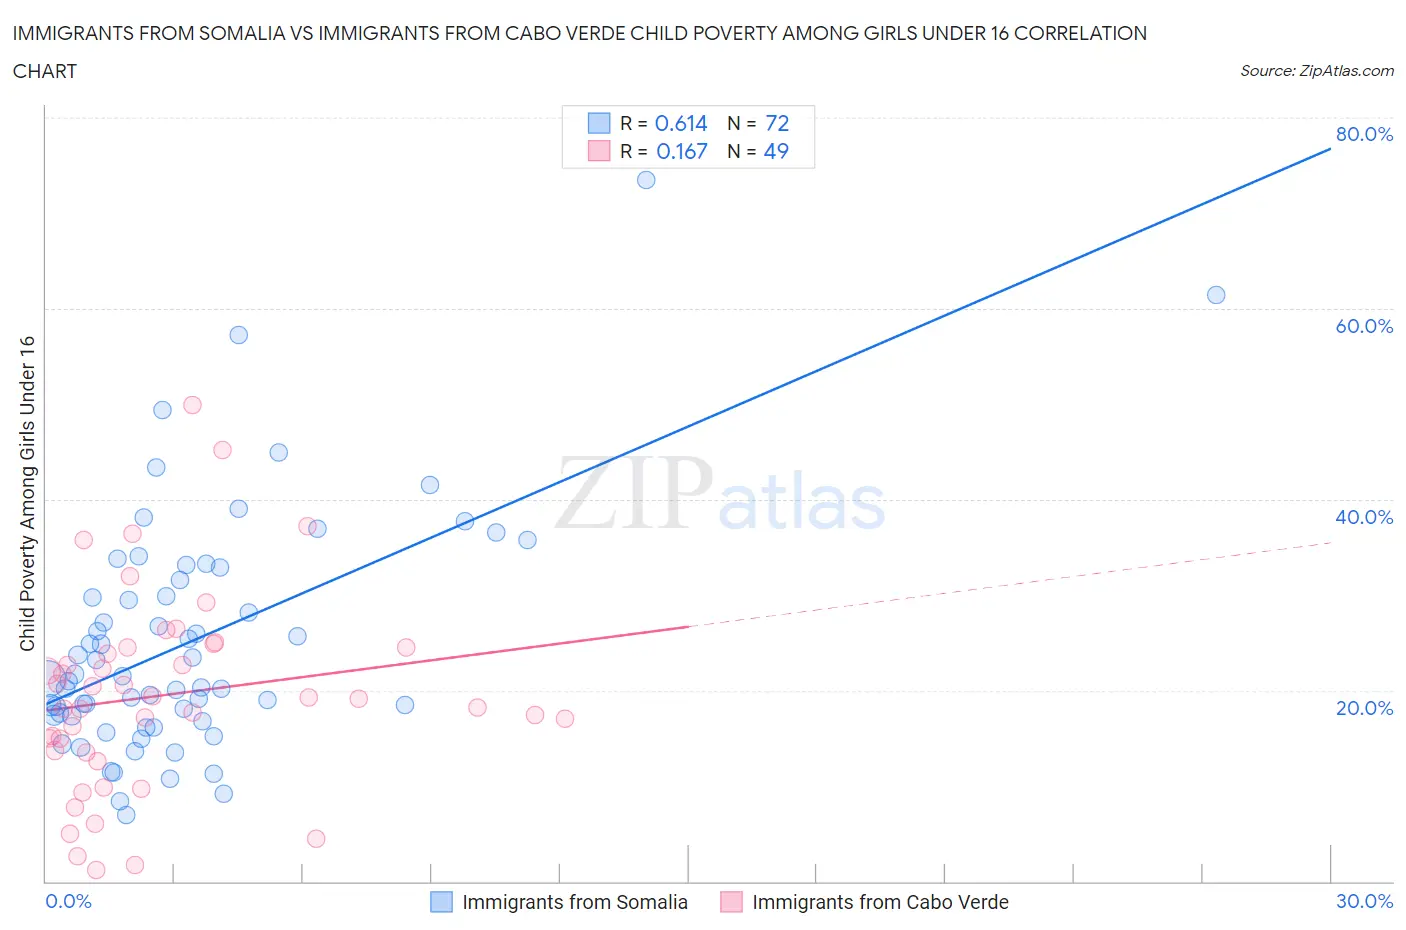
Immigrants from Somalia vs Immigrants from Cabo Verde Child Poverty Among Girls Under 16 Correlation Chart
The statistical analysis conducted on geographies consisting of 91,884,287 people shows a significant positive correlation between the proportion of Immigrants from Somalia and poverty level among girls under the age of 16 in the United States with a correlation coefficient (R) of 0.614 and weighted average of 21.6%. Similarly, the statistical analysis conducted on geographies consisting of 37,949,011 people shows a poor positive correlation between the proportion of Immigrants from Cabo Verde and poverty level among girls under the age of 16 in the United States with a correlation coefficient (R) of 0.167 and weighted average of 20.3%, a difference of 6.0%.
Child Poverty Among Girls Under 16 Correlation Summary
| Measurement | Immigrants from Somalia | Immigrants from Cabo Verde |
| Minimum | 6.9% | 1.1% |
| Maximum | 73.5% | 49.9% |
| Range | 66.6% | 48.7% |
| Mean | 25.2% | 19.5% |
| Median | 21.3% | 19.1% |
| Interquartile 25% (IQ1) | 17.4% | 13.6% |
| Interquartile 75% (IQ3) | 32.2% | 24.5% |
| Interquartile Range (IQR) | 14.8% | 10.9% |
| Standard Deviation (Sample) | 12.5% | 10.4% |
| Standard Deviation (Population) | 12.4% | 10.3% |
Similar Demographics by Child Poverty Among Girls Under 16
Demographics Similar to Immigrants from Somalia by Child Poverty Among Girls Under 16
In terms of child poverty among girls under 16, the demographic groups most similar to Immigrants from Somalia are Dutch West Indian (21.6%, a difference of 0.060%), Bahamian (21.5%, a difference of 0.27%), Immigrants from Mexico (21.6%, a difference of 0.29%), Houma (21.5%, a difference of 0.39%), and Immigrants from Bahamas (21.4%, a difference of 0.57%).
| Demographics | Rating | Rank | Child Poverty Among Girls Under 16 |
| British West Indians | 0.0 /100 | #303 | Tragic 21.3% |
| Indonesians | 0.0 /100 | #304 | Tragic 21.3% |
| Guatemalans | 0.0 /100 | #305 | Tragic 21.4% |
| Immigrants | Central America | 0.0 /100 | #306 | Tragic 21.4% |
| Immigrants | Bahamas | 0.0 /100 | #307 | Tragic 21.4% |
| Houma | 0.0 /100 | #308 | Tragic 21.5% |
| Bahamians | 0.0 /100 | #309 | Tragic 21.5% |
| Immigrants | Somalia | 0.0 /100 | #310 | Tragic 21.6% |
| Dutch West Indians | 0.0 /100 | #311 | Tragic 21.6% |
| Immigrants | Mexico | 0.0 /100 | #312 | Tragic 21.6% |
| Creek | 0.0 /100 | #313 | Tragic 21.7% |
| Arapaho | 0.0 /100 | #314 | Tragic 21.7% |
| Ute | 0.0 /100 | #315 | Tragic 21.8% |
| Immigrants | Guatemala | 0.0 /100 | #316 | Tragic 21.9% |
| Africans | 0.0 /100 | #317 | Tragic 21.9% |
Demographics Similar to Immigrants from Cabo Verde by Child Poverty Among Girls Under 16
In terms of child poverty among girls under 16, the demographic groups most similar to Immigrants from Cabo Verde are Yaqui (20.3%, a difference of 0.14%), Senegalese (20.3%, a difference of 0.17%), West Indian (20.3%, a difference of 0.22%), Iroquois (20.4%, a difference of 0.39%), and Central American (20.2%, a difference of 0.50%).
| Demographics | Rating | Rank | Child Poverty Among Girls Under 16 |
| Barbadians | 0.0 /100 | #278 | Tragic 20.2% |
| Immigrants | Zaire | 0.0 /100 | #279 | Tragic 20.2% |
| Immigrants | Liberia | 0.0 /100 | #280 | Tragic 20.2% |
| Central Americans | 0.0 /100 | #281 | Tragic 20.2% |
| West Indians | 0.0 /100 | #282 | Tragic 20.3% |
| Senegalese | 0.0 /100 | #283 | Tragic 20.3% |
| Yaqui | 0.0 /100 | #284 | Tragic 20.3% |
| Immigrants | Cabo Verde | 0.0 /100 | #285 | Tragic 20.3% |
| Iroquois | 0.0 /100 | #286 | Tragic 20.4% |
| Blackfeet | 0.0 /100 | #287 | Tragic 20.5% |
| Haitians | 0.0 /100 | #288 | Tragic 20.5% |
| Immigrants | Belize | 0.0 /100 | #289 | Tragic 20.6% |
| Immigrants | Haiti | 0.0 /100 | #290 | Tragic 20.6% |
| Chippewa | 0.0 /100 | #291 | Tragic 20.6% |
| Immigrants | Latin America | 0.0 /100 | #292 | Tragic 20.6% |