Immigrants from Singapore vs Afghan Receiving Food Stamps
COMPARE
Immigrants from Singapore
Afghan
Receiving Food Stamps
Receiving Food Stamps Comparison
Immigrants from Singapore
Afghans
8.3%
RECEIVING FOOD STAMPS
100.0/ 100
METRIC RATING
6th/ 347
METRIC RANK
10.7%
RECEIVING FOOD STAMPS
92.6/ 100
METRIC RATING
126th/ 347
METRIC RANK
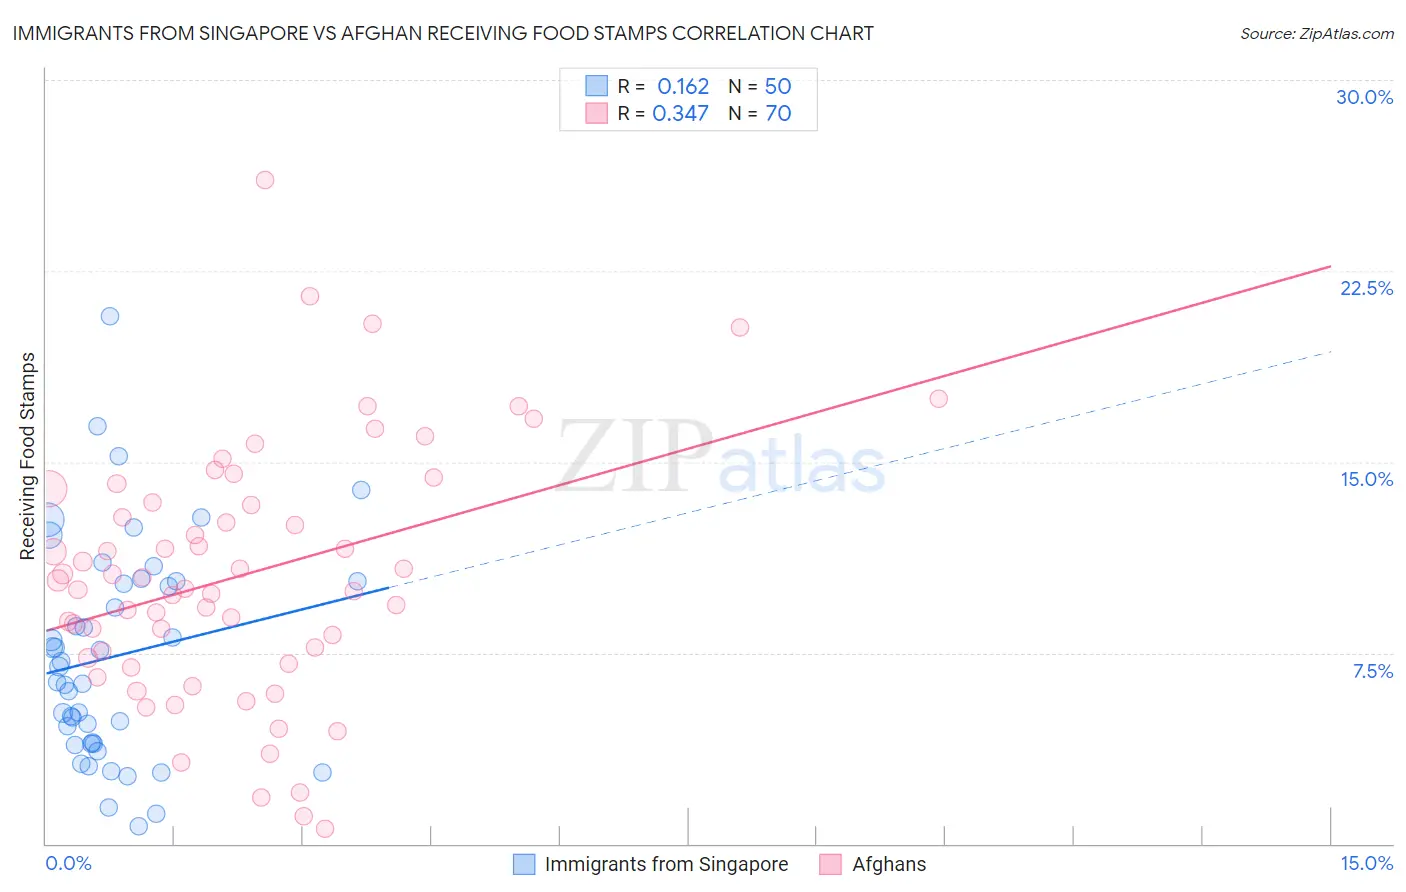
Immigrants from Singapore vs Afghan Receiving Food Stamps Correlation Chart
The statistical analysis conducted on geographies consisting of 137,241,219 people shows a poor positive correlation between the proportion of Immigrants from Singapore and percentage of population receiving government assistance and/or food stamps in the United States with a correlation coefficient (R) of 0.162 and weighted average of 8.3%. Similarly, the statistical analysis conducted on geographies consisting of 148,722,422 people shows a mild positive correlation between the proportion of Afghans and percentage of population receiving government assistance and/or food stamps in the United States with a correlation coefficient (R) of 0.347 and weighted average of 10.7%, a difference of 28.9%.
Receiving Food Stamps Correlation Summary
| Measurement | Immigrants from Singapore | Afghan |
| Minimum | 0.70% | 0.60% |
| Maximum | 20.7% | 26.1% |
| Range | 20.0% | 25.5% |
| Mean | 7.4% | 10.5% |
| Median | 6.7% | 10.2% |
| Interquartile 25% (IQ1) | 3.9% | 7.3% |
| Interquartile 75% (IQ3) | 10.3% | 13.4% |
| Interquartile Range (IQR) | 6.4% | 6.1% |
| Standard Deviation (Sample) | 4.3% | 5.0% |
| Standard Deviation (Population) | 4.2% | 4.9% |
Similar Demographics by Receiving Food Stamps
Demographics Similar to Immigrants from Singapore by Receiving Food Stamps
In terms of receiving food stamps, the demographic groups most similar to Immigrants from Singapore are Immigrants from Iran (8.3%, a difference of 0.56%), Thai (8.1%, a difference of 2.3%), Burmese (8.6%, a difference of 4.2%), Immigrants from Korea (8.7%, a difference of 4.4%), and Iranian (7.9%, a difference of 4.6%).
| Demographics | Rating | Rank | Receiving Food Stamps |
| Immigrants | Taiwan | 100.0 /100 | #1 | Exceptional 7.3% |
| Immigrants | India | 100.0 /100 | #2 | Exceptional 7.4% |
| Filipinos | 100.0 /100 | #3 | Exceptional 7.4% |
| Iranians | 100.0 /100 | #4 | Exceptional 7.9% |
| Thais | 100.0 /100 | #5 | Exceptional 8.1% |
| Immigrants | Singapore | 100.0 /100 | #6 | Exceptional 8.3% |
| Immigrants | Iran | 100.0 /100 | #7 | Exceptional 8.3% |
| Burmese | 99.9 /100 | #8 | Exceptional 8.6% |
| Immigrants | Korea | 99.9 /100 | #9 | Exceptional 8.7% |
| Immigrants | South Central Asia | 99.9 /100 | #10 | Exceptional 8.8% |
| Okinawans | 99.9 /100 | #11 | Exceptional 8.9% |
| Cypriots | 99.9 /100 | #12 | Exceptional 8.9% |
| Bulgarians | 99.9 /100 | #13 | Exceptional 8.9% |
| Maltese | 99.9 /100 | #14 | Exceptional 8.9% |
| Norwegians | 99.9 /100 | #15 | Exceptional 9.0% |
Demographics Similar to Afghans by Receiving Food Stamps
In terms of receiving food stamps, the demographic groups most similar to Afghans are Immigrants from Ethiopia (10.7%, a difference of 0.020%), Immigrants from Jordan (10.7%, a difference of 0.030%), Yugoslavian (10.7%, a difference of 0.030%), Israeli (10.7%, a difference of 0.13%), and Ukrainian (10.7%, a difference of 0.14%).
| Demographics | Rating | Rank | Receiving Food Stamps |
| Immigrants | Poland | 93.9 /100 | #119 | Exceptional 10.6% |
| Ethiopians | 93.9 /100 | #120 | Exceptional 10.6% |
| Slavs | 93.8 /100 | #121 | Exceptional 10.6% |
| Sri Lankans | 93.7 /100 | #122 | Exceptional 10.6% |
| Immigrants | Philippines | 93.3 /100 | #123 | Exceptional 10.7% |
| Paraguayans | 93.0 /100 | #124 | Exceptional 10.7% |
| Ukrainians | 92.8 /100 | #125 | Exceptional 10.7% |
| Afghans | 92.6 /100 | #126 | Exceptional 10.7% |
| Immigrants | Ethiopia | 92.6 /100 | #127 | Exceptional 10.7% |
| Immigrants | Jordan | 92.5 /100 | #128 | Exceptional 10.7% |
| Yugoslavians | 92.5 /100 | #129 | Exceptional 10.7% |
| Israelis | 92.4 /100 | #130 | Exceptional 10.7% |
| French | 92.3 /100 | #131 | Exceptional 10.7% |
| Immigrants | Germany | 92.0 /100 | #132 | Exceptional 10.7% |
| Immigrants | Russia | 90.9 /100 | #133 | Exceptional 10.8% |