Immigrants from Singapore vs Central American Indian Receiving Food Stamps
COMPARE
Immigrants from Singapore
Central American Indian
Receiving Food Stamps
Receiving Food Stamps Comparison
Immigrants from Singapore
Central American Indians
8.3%
RECEIVING FOOD STAMPS
100.0/ 100
METRIC RATING
6th/ 347
METRIC RANK
17.1%
RECEIVING FOOD STAMPS
0.0/ 100
METRIC RATING
316th/ 347
METRIC RANK
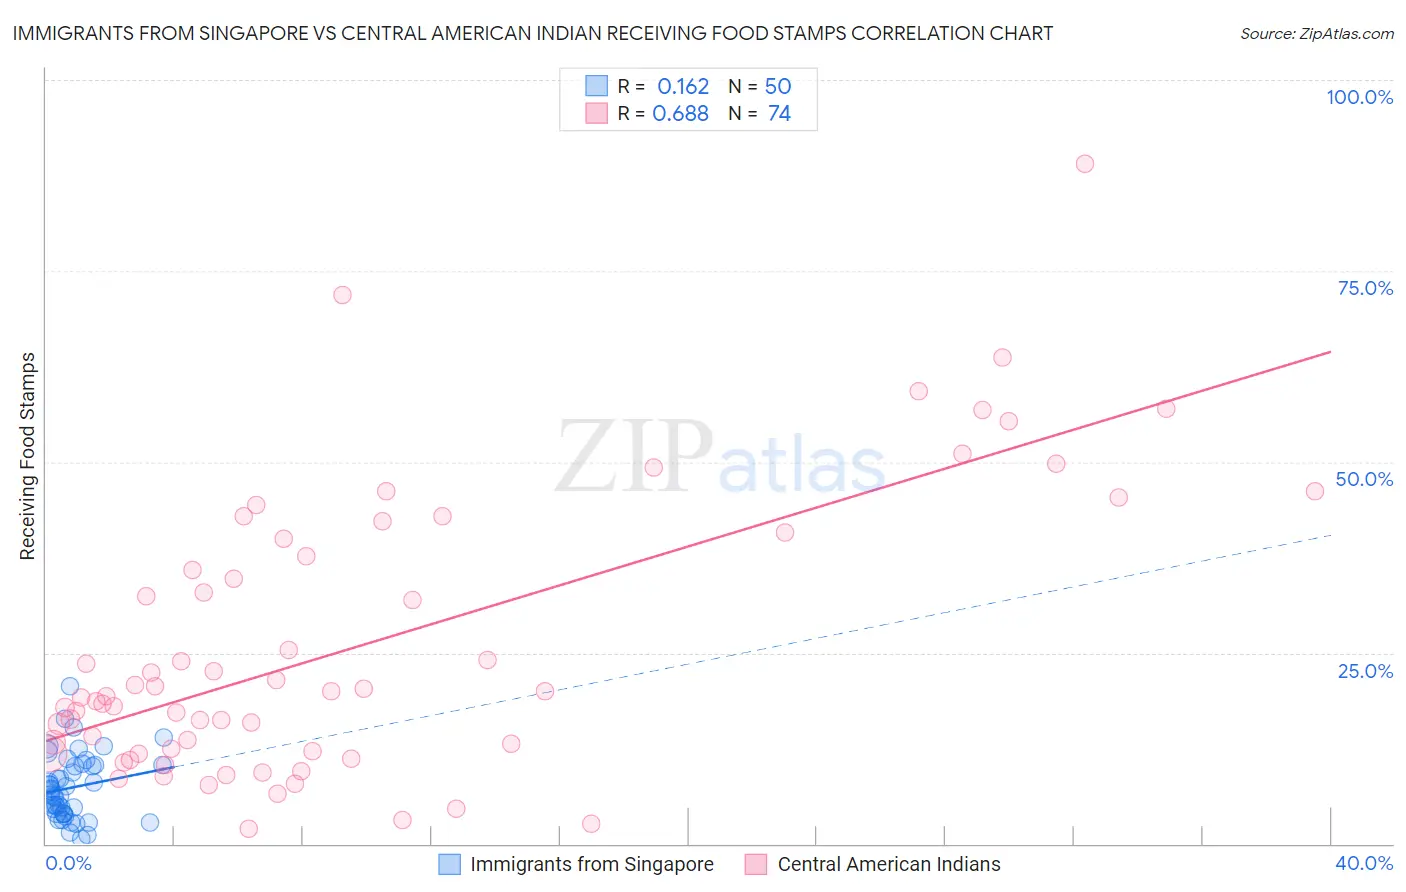
Immigrants from Singapore vs Central American Indian Receiving Food Stamps Correlation Chart
The statistical analysis conducted on geographies consisting of 137,241,219 people shows a poor positive correlation between the proportion of Immigrants from Singapore and percentage of population receiving government assistance and/or food stamps in the United States with a correlation coefficient (R) of 0.162 and weighted average of 8.3%. Similarly, the statistical analysis conducted on geographies consisting of 325,864,154 people shows a significant positive correlation between the proportion of Central American Indians and percentage of population receiving government assistance and/or food stamps in the United States with a correlation coefficient (R) of 0.688 and weighted average of 17.1%, a difference of 105.7%.
Receiving Food Stamps Correlation Summary
| Measurement | Immigrants from Singapore | Central American Indian |
| Minimum | 0.70% | 1.9% |
| Maximum | 20.7% | 89.1% |
| Range | 20.0% | 87.2% |
| Mean | 7.4% | 25.9% |
| Median | 6.7% | 19.6% |
| Interquartile 25% (IQ1) | 3.9% | 12.1% |
| Interquartile 75% (IQ3) | 10.3% | 40.0% |
| Interquartile Range (IQR) | 6.4% | 27.9% |
| Standard Deviation (Sample) | 4.3% | 18.3% |
| Standard Deviation (Population) | 4.2% | 18.2% |
Similar Demographics by Receiving Food Stamps
Demographics Similar to Immigrants from Singapore by Receiving Food Stamps
In terms of receiving food stamps, the demographic groups most similar to Immigrants from Singapore are Immigrants from Iran (8.3%, a difference of 0.56%), Thai (8.1%, a difference of 2.3%), Burmese (8.6%, a difference of 4.2%), Immigrants from Korea (8.7%, a difference of 4.4%), and Iranian (7.9%, a difference of 4.6%).
| Demographics | Rating | Rank | Receiving Food Stamps |
| Immigrants | Taiwan | 100.0 /100 | #1 | Exceptional 7.3% |
| Immigrants | India | 100.0 /100 | #2 | Exceptional 7.4% |
| Filipinos | 100.0 /100 | #3 | Exceptional 7.4% |
| Iranians | 100.0 /100 | #4 | Exceptional 7.9% |
| Thais | 100.0 /100 | #5 | Exceptional 8.1% |
| Immigrants | Singapore | 100.0 /100 | #6 | Exceptional 8.3% |
| Immigrants | Iran | 100.0 /100 | #7 | Exceptional 8.3% |
| Burmese | 99.9 /100 | #8 | Exceptional 8.6% |
| Immigrants | Korea | 99.9 /100 | #9 | Exceptional 8.7% |
| Immigrants | South Central Asia | 99.9 /100 | #10 | Exceptional 8.8% |
| Okinawans | 99.9 /100 | #11 | Exceptional 8.9% |
| Cypriots | 99.9 /100 | #12 | Exceptional 8.9% |
| Bulgarians | 99.9 /100 | #13 | Exceptional 8.9% |
| Maltese | 99.9 /100 | #14 | Exceptional 8.9% |
| Norwegians | 99.9 /100 | #15 | Exceptional 9.0% |
Demographics Similar to Central American Indians by Receiving Food Stamps
In terms of receiving food stamps, the demographic groups most similar to Central American Indians are Bahamian (17.0%, a difference of 0.45%), Black/African American (17.2%, a difference of 0.53%), Menominee (17.2%, a difference of 0.70%), Immigrants from St. Vincent and the Grenadines (17.2%, a difference of 0.88%), and Immigrants from Nicaragua (17.2%, a difference of 0.96%).
| Demographics | Rating | Rank | Receiving Food Stamps |
| U.S. Virgin Islanders | 0.0 /100 | #309 | Tragic 16.5% |
| Immigrants | Barbados | 0.0 /100 | #310 | Tragic 16.6% |
| Guyanese | 0.0 /100 | #311 | Tragic 16.7% |
| Sioux | 0.0 /100 | #312 | Tragic 16.8% |
| Immigrants | Jamaica | 0.0 /100 | #313 | Tragic 16.9% |
| Immigrants | Guyana | 0.0 /100 | #314 | Tragic 16.9% |
| Bahamians | 0.0 /100 | #315 | Tragic 17.0% |
| Central American Indians | 0.0 /100 | #316 | Tragic 17.1% |
| Blacks/African Americans | 0.0 /100 | #317 | Tragic 17.2% |
| Menominee | 0.0 /100 | #318 | Tragic 17.2% |
| Immigrants | St. Vincent and the Grenadines | 0.0 /100 | #319 | Tragic 17.2% |
| Immigrants | Nicaragua | 0.0 /100 | #320 | Tragic 17.2% |
| Natives/Alaskans | 0.0 /100 | #321 | Tragic 17.3% |
| Immigrants | Grenada | 0.0 /100 | #322 | Tragic 17.8% |
| Haitians | 0.0 /100 | #323 | Tragic 17.8% |