Immigrants from Sierra Leone vs Ute Cognitive Disability
COMPARE
Immigrants from Sierra Leone
Ute
Cognitive Disability
Cognitive Disability Comparison
Immigrants from Sierra Leone
Ute
17.6%
COGNITIVE DISABILITY
6.3/ 100
METRIC RATING
219th/ 347
METRIC RANK
17.3%
COGNITIVE DISABILITY
49.1/ 100
METRIC RATING
177th/ 347
METRIC RANK
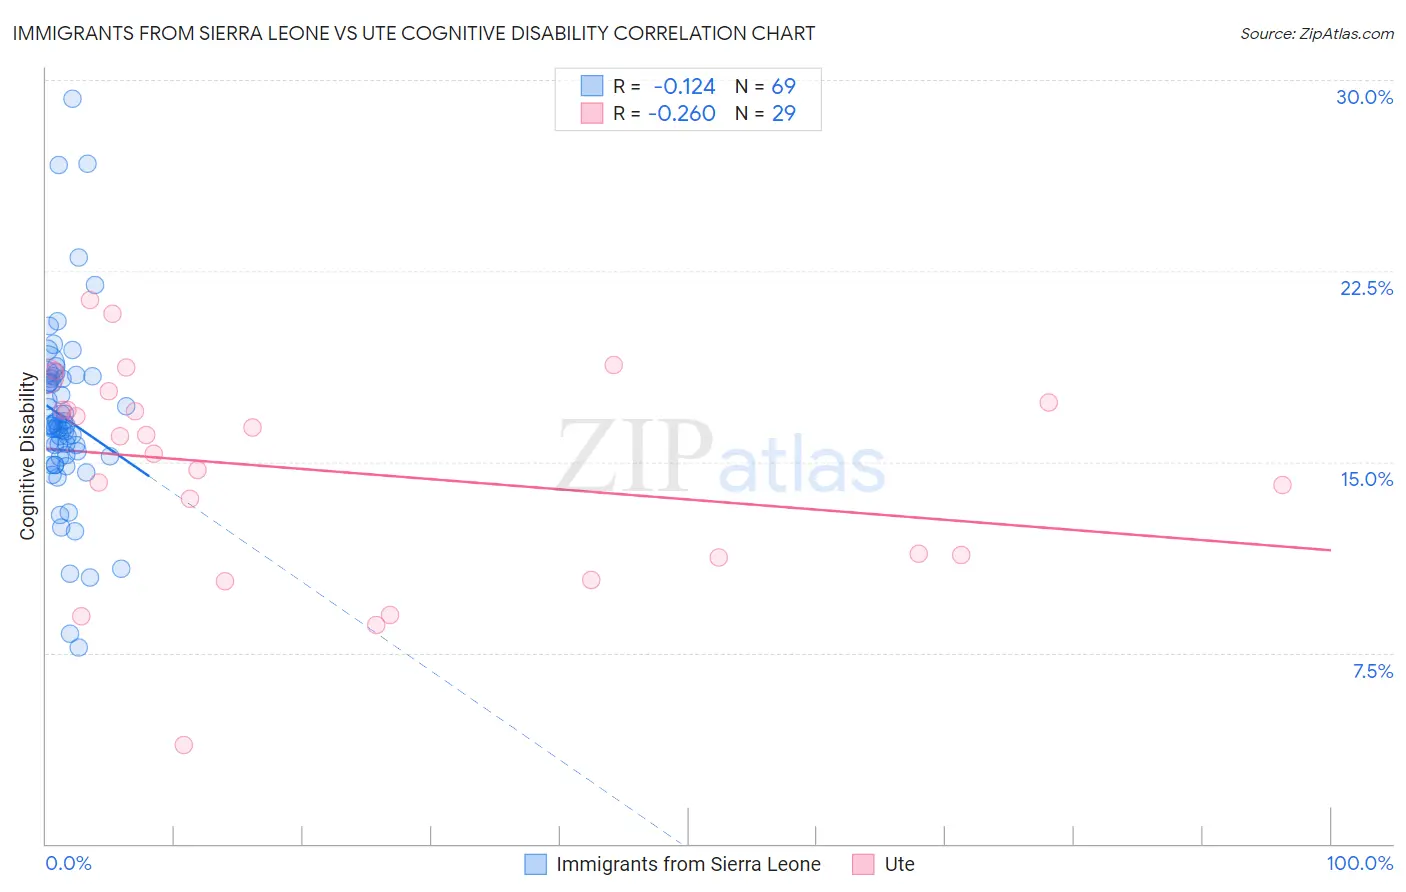
Immigrants from Sierra Leone vs Ute Cognitive Disability Correlation Chart
The statistical analysis conducted on geographies consisting of 101,650,758 people shows a poor negative correlation between the proportion of Immigrants from Sierra Leone and percentage of population with cognitive disability in the United States with a correlation coefficient (R) of -0.124 and weighted average of 17.6%. Similarly, the statistical analysis conducted on geographies consisting of 55,658,356 people shows a weak negative correlation between the proportion of Ute and percentage of population with cognitive disability in the United States with a correlation coefficient (R) of -0.260 and weighted average of 17.3%, a difference of 1.9%.
Cognitive Disability Correlation Summary
| Measurement | Immigrants from Sierra Leone | Ute |
| Minimum | 7.7% | 3.9% |
| Maximum | 29.3% | 21.4% |
| Range | 21.6% | 17.5% |
| Mean | 16.7% | 14.6% |
| Median | 16.4% | 16.0% |
| Interquartile 25% (IQ1) | 15.2% | 11.3% |
| Interquartile 75% (IQ3) | 18.3% | 17.6% |
| Interquartile Range (IQR) | 3.1% | 6.3% |
| Standard Deviation (Sample) | 3.6% | 4.1% |
| Standard Deviation (Population) | 3.6% | 4.1% |
Similar Demographics by Cognitive Disability
Demographics Similar to Immigrants from Sierra Leone by Cognitive Disability
In terms of cognitive disability, the demographic groups most similar to Immigrants from Sierra Leone are Icelander (17.6%, a difference of 0.010%), Zimbabwean (17.6%, a difference of 0.030%), Salvadoran (17.6%, a difference of 0.040%), Moroccan (17.6%, a difference of 0.050%), and Okinawan (17.6%, a difference of 0.060%).
| Demographics | Rating | Rank | Cognitive Disability |
| Immigrants | Oceania | 7.3 /100 | #212 | Tragic 17.6% |
| Hawaiians | 7.2 /100 | #213 | Tragic 17.6% |
| Immigrants | El Salvador | 7.0 /100 | #214 | Tragic 17.6% |
| Alaskan Athabascans | 6.9 /100 | #215 | Tragic 17.6% |
| Okinawans | 6.8 /100 | #216 | Tragic 17.6% |
| Salvadorans | 6.7 /100 | #217 | Tragic 17.6% |
| Icelanders | 6.4 /100 | #218 | Tragic 17.6% |
| Immigrants | Sierra Leone | 6.3 /100 | #219 | Tragic 17.6% |
| Zimbabweans | 6.1 /100 | #220 | Tragic 17.6% |
| Moroccans | 5.9 /100 | #221 | Tragic 17.6% |
| Central Americans | 4.5 /100 | #222 | Tragic 17.7% |
| Alsatians | 4.5 /100 | #223 | Tragic 17.7% |
| Fijians | 3.4 /100 | #224 | Tragic 17.7% |
| Vietnamese | 3.4 /100 | #225 | Tragic 17.7% |
| Marshallese | 2.7 /100 | #226 | Tragic 17.7% |
Demographics Similar to Ute by Cognitive Disability
In terms of cognitive disability, the demographic groups most similar to Ute are Shoshone (17.3%, a difference of 0.0%), Spanish (17.3%, a difference of 0.0%), Sioux (17.3%, a difference of 0.010%), Tsimshian (17.3%, a difference of 0.020%), and Immigrants from Northern Africa (17.3%, a difference of 0.030%).
| Demographics | Rating | Rank | Cognitive Disability |
| Ecuadorians | 59.6 /100 | #170 | Average 17.2% |
| Tlingit-Haida | 59.4 /100 | #171 | Average 17.2% |
| Immigrants | Turkey | 56.7 /100 | #172 | Average 17.2% |
| Immigrants | Northern Africa | 50.2 /100 | #173 | Average 17.3% |
| Laotians | 50.0 /100 | #174 | Average 17.3% |
| Tsimshian | 49.8 /100 | #175 | Average 17.3% |
| Shoshone | 49.2 /100 | #176 | Average 17.3% |
| Ute | 49.1 /100 | #177 | Average 17.3% |
| Spanish | 48.9 /100 | #178 | Average 17.3% |
| Sioux | 48.6 /100 | #179 | Average 17.3% |
| Pakistanis | 43.9 /100 | #180 | Average 17.3% |
| Immigrants | Guyana | 42.9 /100 | #181 | Average 17.3% |
| Arabs | 42.8 /100 | #182 | Average 17.3% |
| Spaniards | 40.3 /100 | #183 | Average 17.3% |
| Crow | 39.1 /100 | #184 | Fair 17.3% |