Immigrants from Sierra Leone vs Immigrants from Canada Female Poverty Among 25-34 Year Olds
COMPARE
Immigrants from Sierra Leone
Immigrants from Canada
Female Poverty Among 25-34 Year Olds
Female Poverty Among 25-34 Year Olds Comparison
Immigrants from Sierra Leone
Immigrants from Canada
13.3%
FEMALE POVERTY AMONG 25-34 YEAR OLDS
72.9/ 100
METRIC RATING
155th/ 347
METRIC RANK
12.9%
FEMALE POVERTY AMONG 25-34 YEAR OLDS
91.5/ 100
METRIC RATING
125th/ 347
METRIC RANK
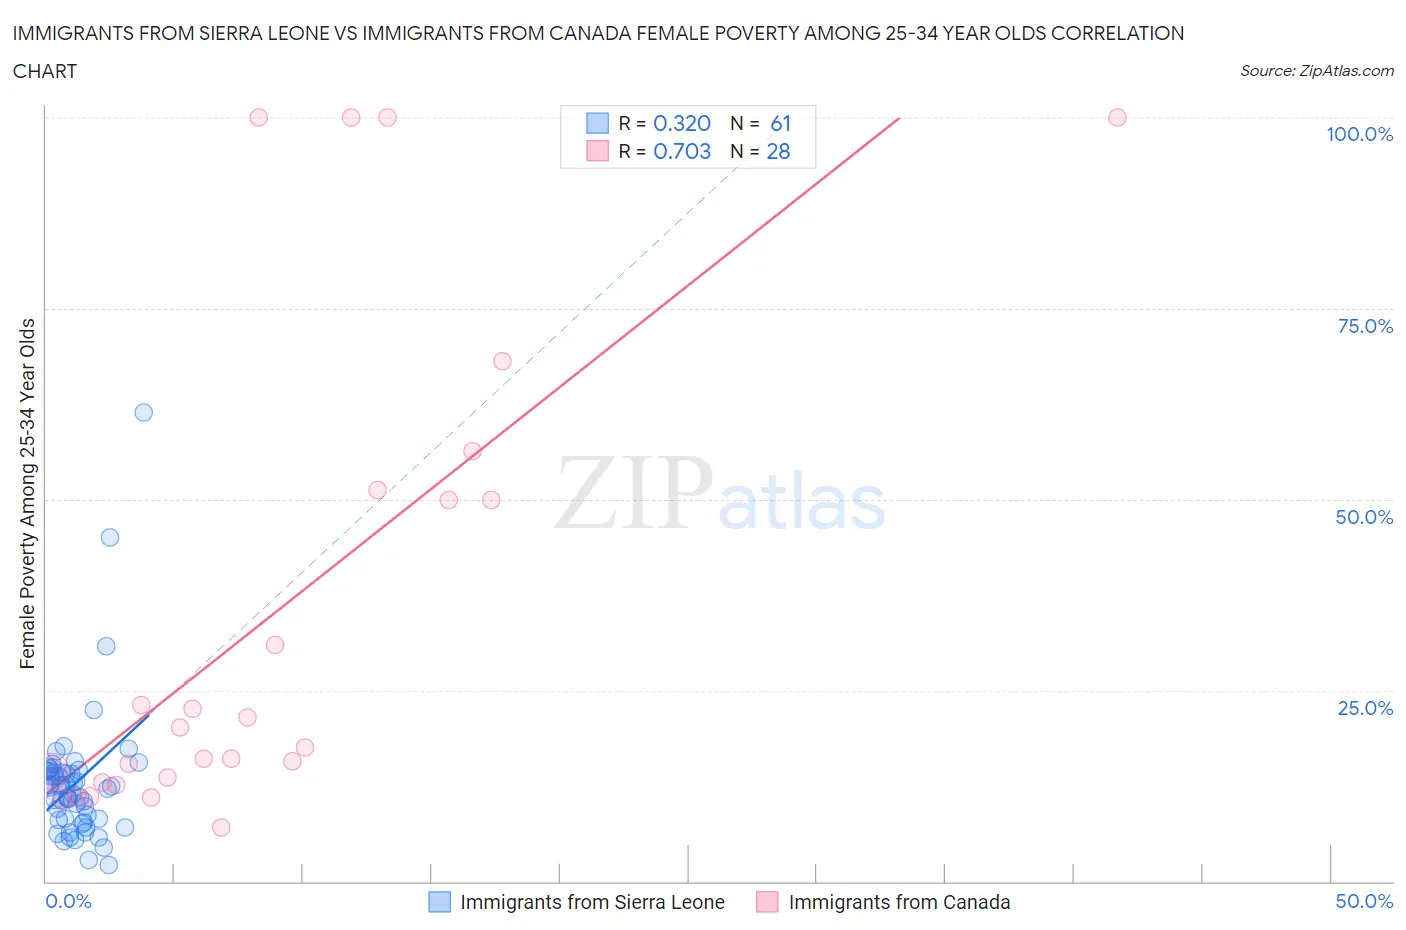
Immigrants from Sierra Leone vs Immigrants from Canada Female Poverty Among 25-34 Year Olds Correlation Chart
The statistical analysis conducted on geographies consisting of 101,180,694 people shows a mild positive correlation between the proportion of Immigrants from Sierra Leone and poverty level among females between the ages 25 and 34 in the United States with a correlation coefficient (R) of 0.320 and weighted average of 13.3%. Similarly, the statistical analysis conducted on geographies consisting of 448,185,141 people shows a strong positive correlation between the proportion of Immigrants from Canada and poverty level among females between the ages 25 and 34 in the United States with a correlation coefficient (R) of 0.703 and weighted average of 12.9%, a difference of 3.0%.
Female Poverty Among 25-34 Year Olds Correlation Summary
| Measurement | Immigrants from Sierra Leone | Immigrants from Canada |
| Minimum | 2.2% | 7.1% |
| Maximum | 61.4% | 100.0% |
| Range | 59.2% | 92.9% |
| Mean | 12.9% | 35.0% |
| Median | 12.4% | 18.8% |
| Interquartile 25% (IQ1) | 8.1% | 13.3% |
| Interquartile 75% (IQ3) | 14.4% | 50.6% |
| Interquartile Range (IQR) | 6.4% | 37.3% |
| Standard Deviation (Sample) | 9.0% | 31.4% |
| Standard Deviation (Population) | 8.9% | 30.8% |
Similar Demographics by Female Poverty Among 25-34 Year Olds
Demographics Similar to Immigrants from Sierra Leone by Female Poverty Among 25-34 Year Olds
In terms of female poverty among 25-34 year olds, the demographic groups most similar to Immigrants from Sierra Leone are Arab (13.2%, a difference of 0.070%), Northern European (13.2%, a difference of 0.090%), Immigrants from Cameroon (13.3%, a difference of 0.090%), Immigrants from Western Europe (13.3%, a difference of 0.27%), and Slavic (13.2%, a difference of 0.32%).
| Demographics | Rating | Rank | Female Poverty Among 25-34 Year Olds |
| Lebanese | 76.8 /100 | #148 | Good 13.2% |
| Sierra Leoneans | 76.3 /100 | #149 | Good 13.2% |
| Iraqis | 76.0 /100 | #150 | Good 13.2% |
| Costa Ricans | 75.8 /100 | #151 | Good 13.2% |
| Slavs | 75.7 /100 | #152 | Good 13.2% |
| Northern Europeans | 73.7 /100 | #153 | Good 13.2% |
| Arabs | 73.5 /100 | #154 | Good 13.2% |
| Immigrants | Sierra Leone | 72.9 /100 | #155 | Good 13.3% |
| Immigrants | Cameroon | 72.0 /100 | #156 | Good 13.3% |
| Immigrants | Western Europe | 70.3 /100 | #157 | Good 13.3% |
| Immigrants | Colombia | 69.2 /100 | #158 | Good 13.3% |
| Uruguayans | 66.9 /100 | #159 | Good 13.3% |
| Immigrants | South America | 66.3 /100 | #160 | Good 13.3% |
| Icelanders | 65.7 /100 | #161 | Good 13.3% |
| Ugandans | 64.1 /100 | #162 | Good 13.4% |
Demographics Similar to Immigrants from Canada by Female Poverty Among 25-34 Year Olds
In terms of female poverty among 25-34 year olds, the demographic groups most similar to Immigrants from Canada are Immigrants from Fiji (12.9%, a difference of 0.080%), Immigrants from Netherlands (12.8%, a difference of 0.15%), Czech (12.9%, a difference of 0.32%), Syrian (12.9%, a difference of 0.33%), and Slovene (12.8%, a difference of 0.37%).
| Demographics | Rating | Rank | Female Poverty Among 25-34 Year Olds |
| Mongolians | 93.0 /100 | #118 | Exceptional 12.8% |
| Immigrants | Nepal | 93.0 /100 | #119 | Exceptional 12.8% |
| Carpatho Rusyns | 93.0 /100 | #120 | Exceptional 12.8% |
| Romanians | 92.8 /100 | #121 | Exceptional 12.8% |
| Immigrants | Western Asia | 92.7 /100 | #122 | Exceptional 12.8% |
| Slovenes | 92.7 /100 | #123 | Exceptional 12.8% |
| Immigrants | Netherlands | 92.0 /100 | #124 | Exceptional 12.8% |
| Immigrants | Canada | 91.5 /100 | #125 | Exceptional 12.9% |
| Immigrants | Fiji | 91.2 /100 | #126 | Exceptional 12.9% |
| Czechs | 90.3 /100 | #127 | Exceptional 12.9% |
| Syrians | 90.2 /100 | #128 | Exceptional 12.9% |
| Immigrants | North America | 89.7 /100 | #129 | Excellent 12.9% |
| Immigrants | Uzbekistan | 89.6 /100 | #130 | Excellent 12.9% |
| Pakistanis | 88.4 /100 | #131 | Excellent 13.0% |
| Immigrants | Hungary | 88.3 /100 | #132 | Excellent 13.0% |