Immigrants from Senegal vs Immigrants from Guatemala Child Poverty Among Boys Under 16
COMPARE
Immigrants from Senegal
Immigrants from Guatemala
Child Poverty Among Boys Under 16
Child Poverty Among Boys Under 16 Comparison
Immigrants from Senegal
Immigrants from Guatemala
20.7%
CHILD POVERTY AMONG BOYS UNDER 16
0.0/ 100
METRIC RATING
293rd/ 347
METRIC RANK
21.6%
CHILD POVERTY AMONG BOYS UNDER 16
0.0/ 100
METRIC RATING
312th/ 347
METRIC RANK
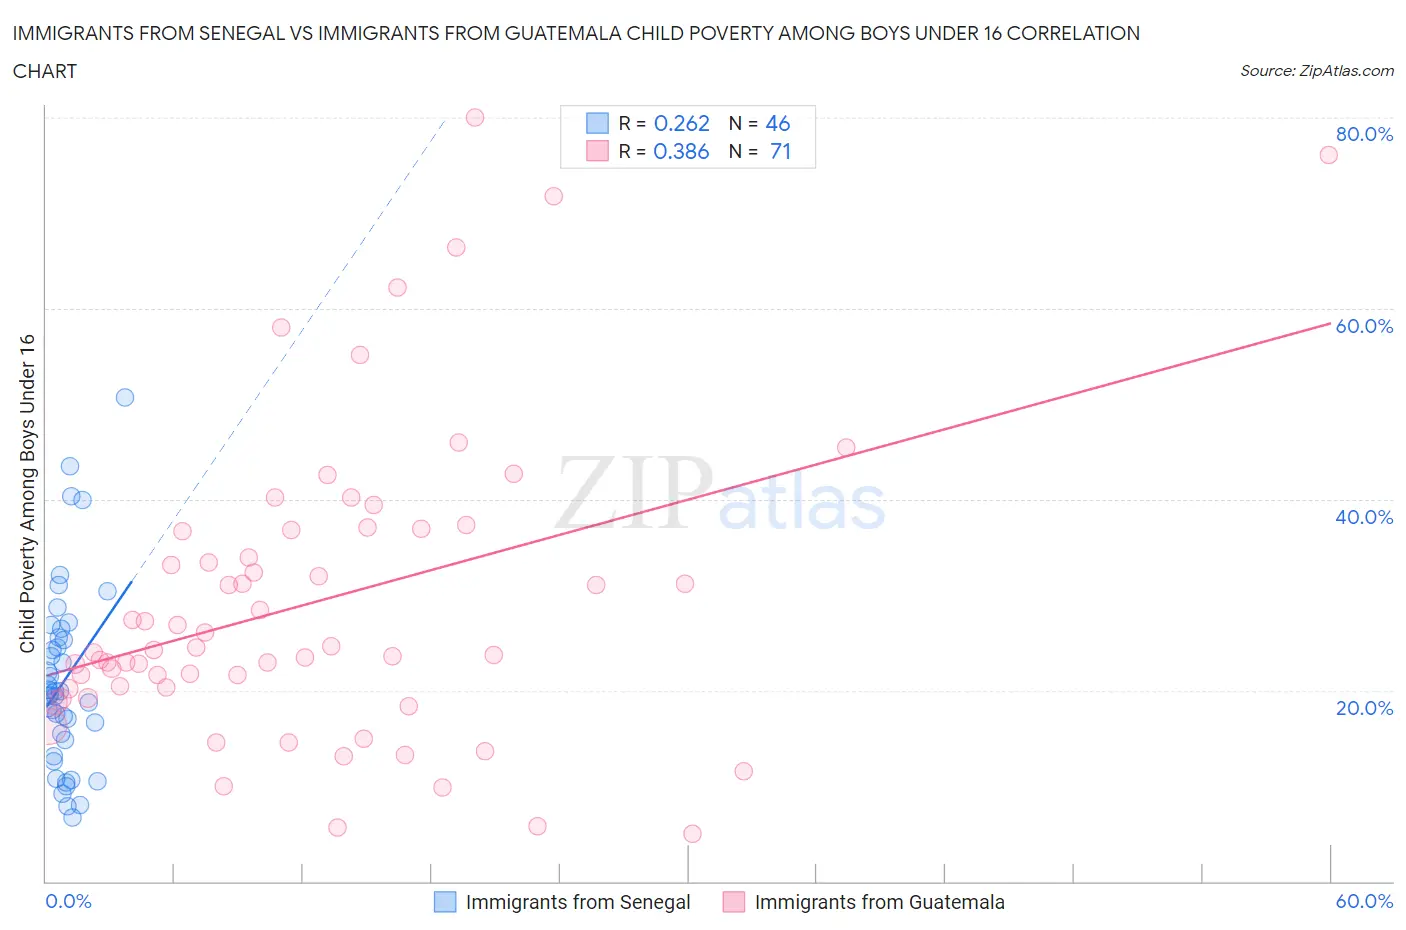
Immigrants from Senegal vs Immigrants from Guatemala Child Poverty Among Boys Under 16 Correlation Chart
The statistical analysis conducted on geographies consisting of 89,864,954 people shows a weak positive correlation between the proportion of Immigrants from Senegal and poverty level among boys under the age of 16 in the United States with a correlation coefficient (R) of 0.262 and weighted average of 20.7%. Similarly, the statistical analysis conducted on geographies consisting of 373,274,395 people shows a mild positive correlation between the proportion of Immigrants from Guatemala and poverty level among boys under the age of 16 in the United States with a correlation coefficient (R) of 0.386 and weighted average of 21.6%, a difference of 4.3%.
Child Poverty Among Boys Under 16 Correlation Summary
| Measurement | Immigrants from Senegal | Immigrants from Guatemala |
| Minimum | 6.7% | 5.0% |
| Maximum | 50.7% | 80.0% |
| Range | 44.0% | 75.0% |
| Mean | 21.0% | 29.2% |
| Median | 19.7% | 24.3% |
| Interquartile 25% (IQ1) | 14.7% | 20.2% |
| Interquartile 75% (IQ3) | 25.5% | 36.8% |
| Interquartile Range (IQR) | 10.7% | 16.6% |
| Standard Deviation (Sample) | 9.7% | 16.0% |
| Standard Deviation (Population) | 9.6% | 15.9% |
Demographics Similar to Immigrants from Senegal and Immigrants from Guatemala by Child Poverty Among Boys Under 16
In terms of child poverty among boys under 16, the demographic groups most similar to Immigrants from Senegal are Yaqui (20.7%, a difference of 0.010%), Immigrants from Bahamas (20.7%, a difference of 0.11%), Mexican (20.7%, a difference of 0.24%), Indonesian (20.8%, a difference of 0.44%), and Hispanic or Latino (20.9%, a difference of 1.1%). Similarly, the demographic groups most similar to Immigrants from Guatemala are Bahamian (21.6%, a difference of 0.080%), Creek (21.5%, a difference of 0.19%), Seminole (21.5%, a difference of 0.25%), Immigrants from Mexico (21.5%, a difference of 0.43%), and Choctaw (21.3%, a difference of 1.1%).
| Demographics | Rating | Rank | Child Poverty Among Boys Under 16 |
| Yaqui | 0.0 /100 | #292 | Tragic 20.7% |
| Immigrants | Senegal | 0.0 /100 | #293 | Tragic 20.7% |
| Immigrants | Bahamas | 0.0 /100 | #294 | Tragic 20.7% |
| Mexicans | 0.0 /100 | #295 | Tragic 20.7% |
| Indonesians | 0.0 /100 | #296 | Tragic 20.8% |
| Hispanics or Latinos | 0.0 /100 | #297 | Tragic 20.9% |
| Chippewa | 0.0 /100 | #298 | Tragic 21.0% |
| Immigrants | Caribbean | 0.0 /100 | #299 | Tragic 21.0% |
| Haitians | 0.0 /100 | #300 | Tragic 21.0% |
| Guatemalans | 0.0 /100 | #301 | Tragic 21.1% |
| Somalis | 0.0 /100 | #302 | Tragic 21.1% |
| Immigrants | Haiti | 0.0 /100 | #303 | Tragic 21.3% |
| Immigrants | Central America | 0.0 /100 | #304 | Tragic 21.3% |
| Kiowa | 0.0 /100 | #305 | Tragic 21.3% |
| Immigrants | Grenada | 0.0 /100 | #306 | Tragic 21.3% |
| Choctaw | 0.0 /100 | #307 | Tragic 21.3% |
| Immigrants | Mexico | 0.0 /100 | #308 | Tragic 21.5% |
| Seminole | 0.0 /100 | #309 | Tragic 21.5% |
| Creek | 0.0 /100 | #310 | Tragic 21.5% |
| Bahamians | 0.0 /100 | #311 | Tragic 21.6% |
| Immigrants | Guatemala | 0.0 /100 | #312 | Tragic 21.6% |