Immigrants from Portugal vs Immigrants from West Indies Unemployment Among Ages 35 to 44 years
COMPARE
Immigrants from Portugal
Immigrants from West Indies
Unemployment Among Ages 35 to 44 years
Unemployment Among Ages 35 to 44 years Comparison
Immigrants from Portugal
Immigrants from West Indies
5.4%
UNEMPLOYMENT AMONG AGES 35 TO 44 YEARS
0.0/ 100
METRIC RATING
281st/ 347
METRIC RANK
5.6%
UNEMPLOYMENT AMONG AGES 35 TO 44 YEARS
0.0/ 100
METRIC RATING
300th/ 347
METRIC RANK
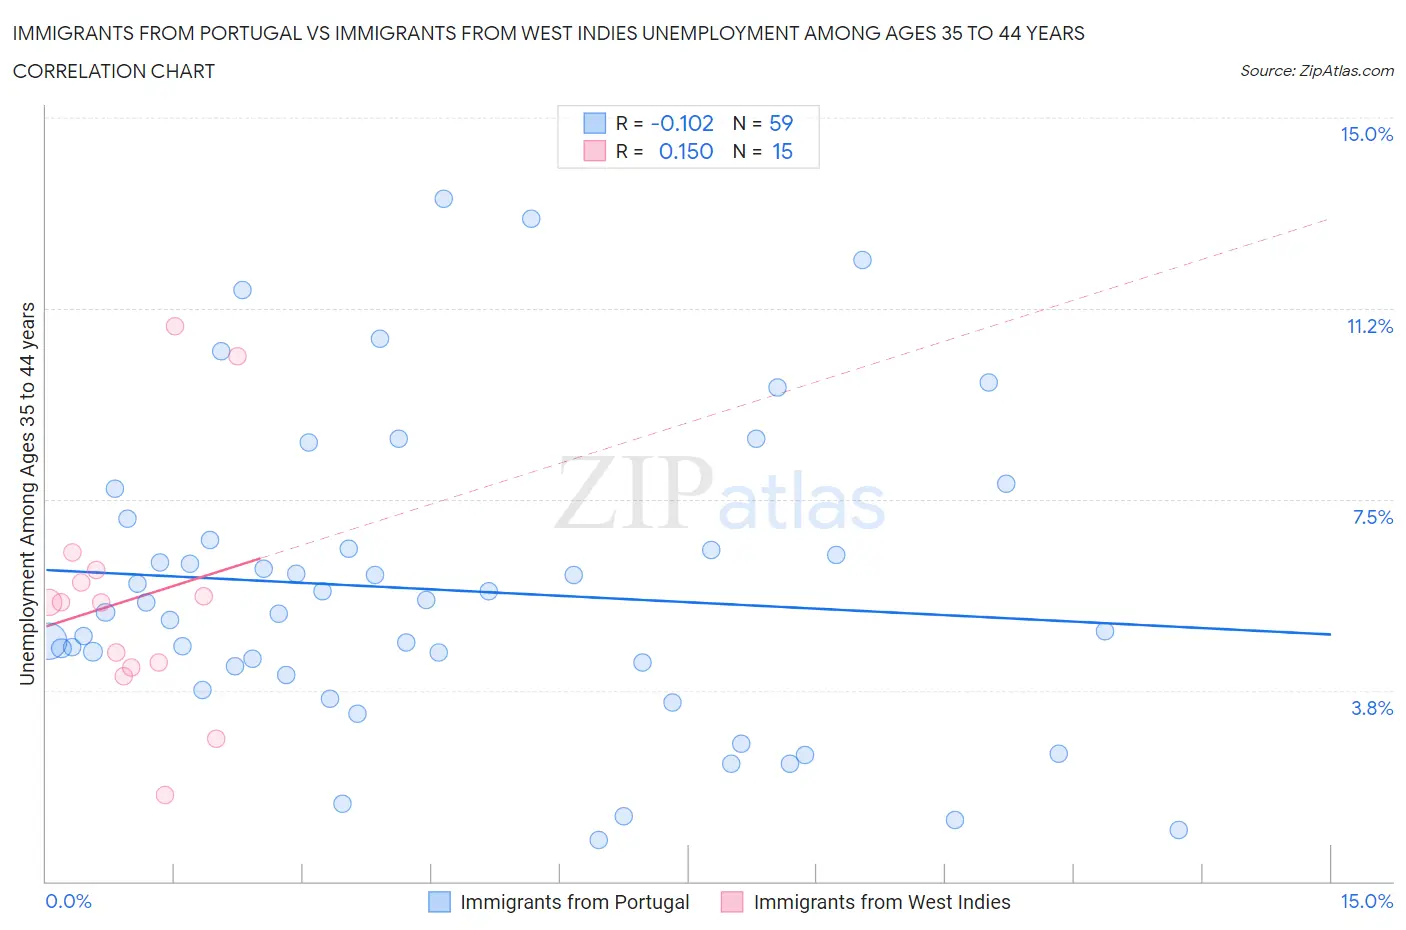
Immigrants from Portugal vs Immigrants from West Indies Unemployment Among Ages 35 to 44 years Correlation Chart
The statistical analysis conducted on geographies consisting of 172,675,995 people shows a poor negative correlation between the proportion of Immigrants from Portugal and unemployment rate among population between the ages 35 and 44 in the United States with a correlation coefficient (R) of -0.102 and weighted average of 5.4%. Similarly, the statistical analysis conducted on geographies consisting of 72,221,527 people shows a poor positive correlation between the proportion of Immigrants from West Indies and unemployment rate among population between the ages 35 and 44 in the United States with a correlation coefficient (R) of 0.150 and weighted average of 5.6%, a difference of 3.6%.
Unemployment Among Ages 35 to 44 years Correlation Summary
| Measurement | Immigrants from Portugal | Immigrants from West Indies |
| Minimum | 0.80% | 1.7% |
| Maximum | 13.4% | 10.9% |
| Range | 12.6% | 9.2% |
| Mean | 5.7% | 5.5% |
| Median | 5.3% | 5.5% |
| Interquartile 25% (IQ1) | 4.1% | 4.2% |
| Interquartile 75% (IQ3) | 6.7% | 6.1% |
| Interquartile Range (IQR) | 2.6% | 1.9% |
| Standard Deviation (Sample) | 2.9% | 2.4% |
| Standard Deviation (Population) | 2.9% | 2.3% |
Demographics Similar to Immigrants from Portugal and Immigrants from West Indies by Unemployment Among Ages 35 to 44 years
In terms of unemployment among ages 35 to 44 years, the demographic groups most similar to Immigrants from Portugal are Ecuadorian (5.4%, a difference of 0.050%), Immigrants from Ghana (5.4%, a difference of 0.39%), Immigrants from Ecuador (5.4%, a difference of 1.0%), Haitian (5.5%, a difference of 1.5%), and Hispanic or Latino (5.5%, a difference of 1.7%). Similarly, the demographic groups most similar to Immigrants from West Indies are Immigrants from Jamaica (5.6%, a difference of 0.050%), Aleut (5.6%, a difference of 0.15%), U.S. Virgin Islander (5.6%, a difference of 0.16%), Immigrants from Trinidad and Tobago (5.6%, a difference of 0.27%), and Ottawa (5.6%, a difference of 0.29%).
| Demographics | Rating | Rank | Unemployment Among Ages 35 to 44 years |
| Ecuadorians | 0.0 /100 | #280 | Tragic 5.4% |
| Immigrants | Portugal | 0.0 /100 | #281 | Tragic 5.4% |
| Immigrants | Ghana | 0.0 /100 | #282 | Tragic 5.4% |
| Immigrants | Ecuador | 0.0 /100 | #283 | Tragic 5.4% |
| Haitians | 0.0 /100 | #284 | Tragic 5.5% |
| Hispanics or Latinos | 0.0 /100 | #285 | Tragic 5.5% |
| Immigrants | Micronesia | 0.0 /100 | #286 | Tragic 5.5% |
| French American Indians | 0.0 /100 | #287 | Tragic 5.5% |
| Cree | 0.0 /100 | #288 | Tragic 5.5% |
| Spanish American Indians | 0.0 /100 | #289 | Tragic 5.5% |
| Jamaicans | 0.0 /100 | #290 | Tragic 5.5% |
| Dutch West Indians | 0.0 /100 | #291 | Tragic 5.5% |
| Immigrants | Haiti | 0.0 /100 | #292 | Tragic 5.5% |
| Central American Indians | 0.0 /100 | #293 | Tragic 5.6% |
| Trinidadians and Tobagonians | 0.0 /100 | #294 | Tragic 5.6% |
| Ottawa | 0.0 /100 | #295 | Tragic 5.6% |
| Immigrants | Trinidad and Tobago | 0.0 /100 | #296 | Tragic 5.6% |
| U.S. Virgin Islanders | 0.0 /100 | #297 | Tragic 5.6% |
| Aleuts | 0.0 /100 | #298 | Tragic 5.6% |
| Immigrants | Jamaica | 0.0 /100 | #299 | Tragic 5.6% |
| Immigrants | West Indies | 0.0 /100 | #300 | Tragic 5.6% |