Immigrants from Poland vs Immigrants from South Central Asia Male Poverty
COMPARE
Immigrants from Poland
Immigrants from South Central Asia
Male Poverty
Male Poverty Comparison
Immigrants from Poland
Immigrants from South Central Asia
9.8%
MALE POVERTY
99.5/ 100
METRIC RATING
34th/ 347
METRIC RANK
9.3%
MALE POVERTY
99.9/ 100
METRIC RATING
9th/ 347
METRIC RANK
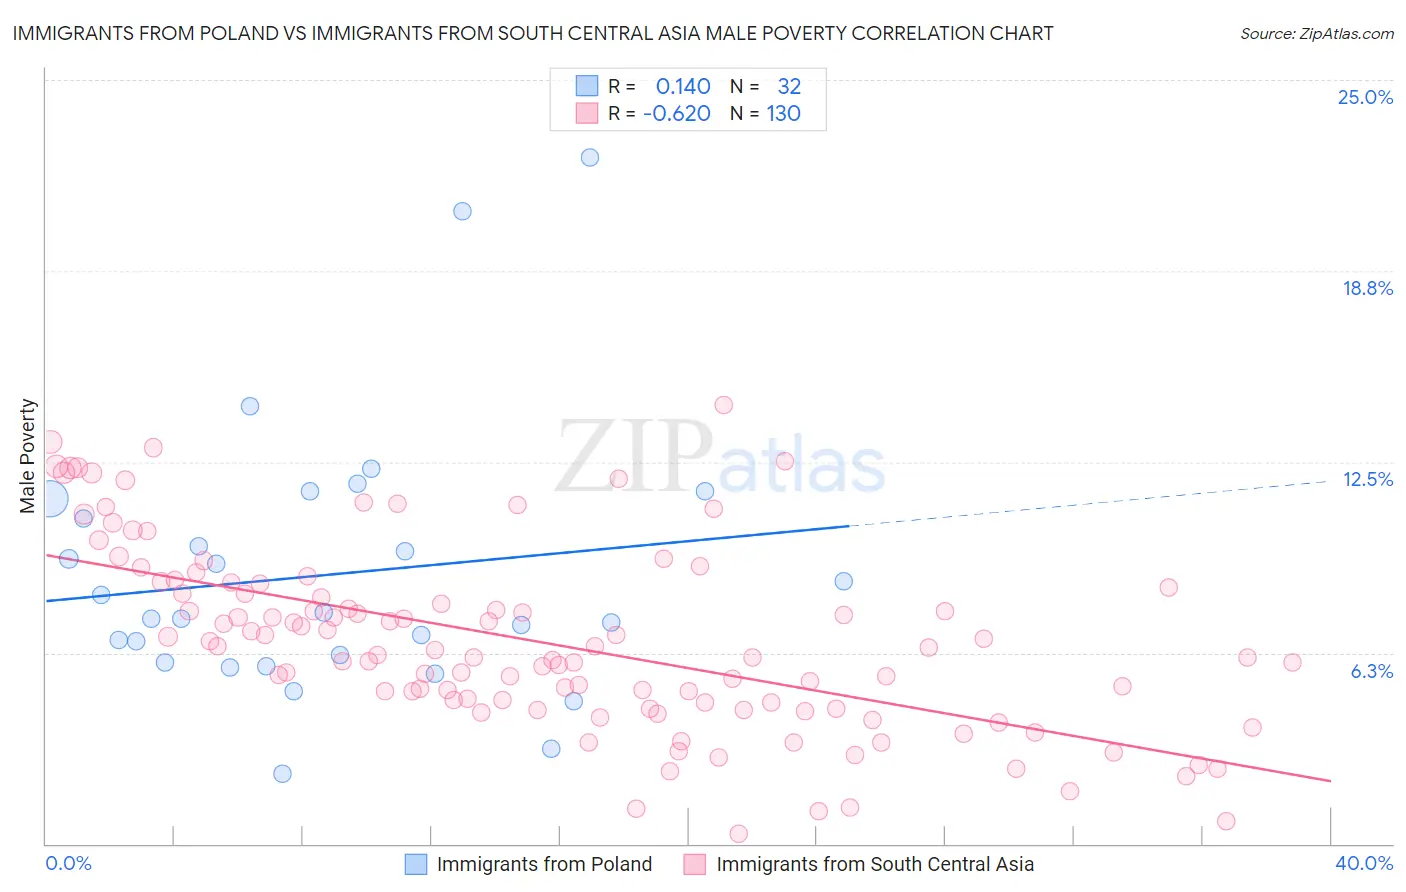
Immigrants from Poland vs Immigrants from South Central Asia Male Poverty Correlation Chart
The statistical analysis conducted on geographies consisting of 304,660,101 people shows a poor positive correlation between the proportion of Immigrants from Poland and poverty level among males in the United States with a correlation coefficient (R) of 0.140 and weighted average of 9.8%. Similarly, the statistical analysis conducted on geographies consisting of 472,354,703 people shows a significant negative correlation between the proportion of Immigrants from South Central Asia and poverty level among males in the United States with a correlation coefficient (R) of -0.620 and weighted average of 9.3%, a difference of 5.2%.
Male Poverty Correlation Summary
| Measurement | Immigrants from Poland | Immigrants from South Central Asia |
| Minimum | 2.3% | 0.33% |
| Maximum | 22.5% | 14.4% |
| Range | 20.2% | 14.0% |
| Mean | 8.8% | 6.6% |
| Median | 7.5% | 6.2% |
| Interquartile 25% (IQ1) | 6.0% | 4.6% |
| Interquartile 75% (IQ3) | 11.0% | 8.4% |
| Interquartile Range (IQR) | 4.9% | 3.8% |
| Standard Deviation (Sample) | 4.3% | 3.0% |
| Standard Deviation (Population) | 4.3% | 3.0% |
Similar Demographics by Male Poverty
Demographics Similar to Immigrants from Poland by Male Poverty
In terms of male poverty, the demographic groups most similar to Immigrants from Poland are Immigrants from Northern Europe (9.7%, a difference of 0.15%), Macedonian (9.7%, a difference of 0.23%), Iranian (9.8%, a difference of 0.30%), Czech (9.8%, a difference of 0.39%), and Tongan (9.7%, a difference of 0.44%).
| Demographics | Rating | Rank | Male Poverty |
| Danes | 99.6 /100 | #27 | Exceptional 9.7% |
| Immigrants | Korea | 99.6 /100 | #28 | Exceptional 9.7% |
| Greeks | 99.6 /100 | #29 | Exceptional 9.7% |
| Poles | 99.5 /100 | #30 | Exceptional 9.7% |
| Tongans | 99.5 /100 | #31 | Exceptional 9.7% |
| Macedonians | 99.5 /100 | #32 | Exceptional 9.7% |
| Immigrants | Northern Europe | 99.5 /100 | #33 | Exceptional 9.7% |
| Immigrants | Poland | 99.5 /100 | #34 | Exceptional 9.8% |
| Iranians | 99.4 /100 | #35 | Exceptional 9.8% |
| Czechs | 99.4 /100 | #36 | Exceptional 9.8% |
| Immigrants | Greece | 99.3 /100 | #37 | Exceptional 9.8% |
| Immigrants | Pakistan | 99.2 /100 | #38 | Exceptional 9.9% |
| Russians | 99.2 /100 | #39 | Exceptional 9.9% |
| Cypriots | 99.2 /100 | #40 | Exceptional 9.9% |
| Koreans | 99.2 /100 | #41 | Exceptional 9.9% |
Demographics Similar to Immigrants from South Central Asia by Male Poverty
In terms of male poverty, the demographic groups most similar to Immigrants from South Central Asia are Bulgarian (9.3%, a difference of 0.56%), Filipino (9.2%, a difference of 0.79%), Bolivian (9.4%, a difference of 1.2%), Immigrants from Bolivia (9.4%, a difference of 1.3%), and Immigrants from Lithuania (9.4%, a difference of 1.4%).
| Demographics | Rating | Rank | Male Poverty |
| Chinese | 100.0 /100 | #2 | Exceptional 8.7% |
| Thais | 100.0 /100 | #3 | Exceptional 8.7% |
| Immigrants | Taiwan | 100.0 /100 | #4 | Exceptional 8.9% |
| Maltese | 100.0 /100 | #5 | Exceptional 9.1% |
| Assyrians/Chaldeans/Syriacs | 99.9 /100 | #6 | Exceptional 9.1% |
| Immigrants | Ireland | 99.9 /100 | #7 | Exceptional 9.1% |
| Filipinos | 99.9 /100 | #8 | Exceptional 9.2% |
| Immigrants | South Central Asia | 99.9 /100 | #9 | Exceptional 9.3% |
| Bulgarians | 99.9 /100 | #10 | Exceptional 9.3% |
| Bolivians | 99.9 /100 | #11 | Exceptional 9.4% |
| Immigrants | Bolivia | 99.9 /100 | #12 | Exceptional 9.4% |
| Immigrants | Lithuania | 99.9 /100 | #13 | Exceptional 9.4% |
| Immigrants | North Macedonia | 99.8 /100 | #14 | Exceptional 9.4% |
| Bhutanese | 99.8 /100 | #15 | Exceptional 9.5% |
| Luxembourgers | 99.8 /100 | #16 | Exceptional 9.5% |