Immigrants from Poland vs Swedish Disability Age Over 75
COMPARE
Immigrants from Poland
Swedish
Disability Age Over 75
Disability Age Over 75 Comparison
Immigrants from Poland
Swedes
45.4%
DISABILITY AGE OVER 75
99.9/ 100
METRIC RATING
27th/ 347
METRIC RANK
45.7%
DISABILITY AGE OVER 75
99.8/ 100
METRIC RATING
46th/ 347
METRIC RANK
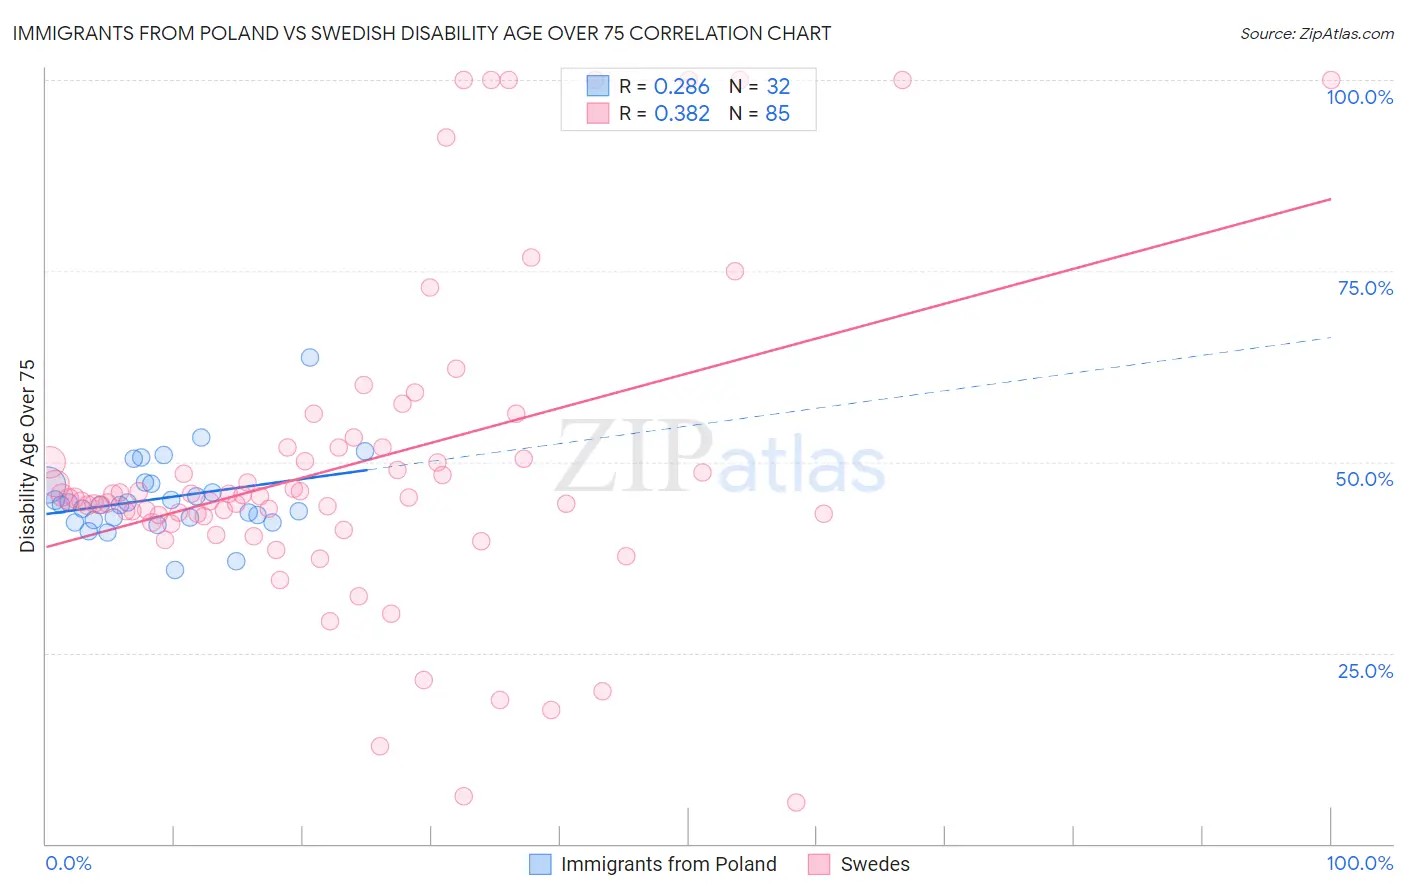
Immigrants from Poland vs Swedish Disability Age Over 75 Correlation Chart
The statistical analysis conducted on geographies consisting of 304,637,447 people shows a weak positive correlation between the proportion of Immigrants from Poland and percentage of population with a disability over the age of 75 in the United States with a correlation coefficient (R) of 0.286 and weighted average of 45.4%. Similarly, the statistical analysis conducted on geographies consisting of 537,534,553 people shows a mild positive correlation between the proportion of Swedes and percentage of population with a disability over the age of 75 in the United States with a correlation coefficient (R) of 0.382 and weighted average of 45.7%, a difference of 0.64%.
Disability Age Over 75 Correlation Summary
| Measurement | Immigrants from Poland | Swedish |
| Minimum | 35.9% | 5.4% |
| Maximum | 63.6% | 100.0% |
| Range | 27.7% | 94.6% |
| Mean | 45.2% | 49.7% |
| Median | 44.4% | 45.3% |
| Interquartile 25% (IQ1) | 42.5% | 42.5% |
| Interquartile 75% (IQ3) | 47.1% | 51.8% |
| Interquartile Range (IQR) | 4.6% | 9.4% |
| Standard Deviation (Sample) | 5.1% | 20.9% |
| Standard Deviation (Population) | 5.0% | 20.7% |
Demographics Similar to Immigrants from Poland and Swedes by Disability Age Over 75
In terms of disability age over 75, the demographic groups most similar to Immigrants from Poland are Macedonian (45.4%, a difference of 0.010%), Thai (45.4%, a difference of 0.020%), Filipino (45.4%, a difference of 0.060%), Immigrants from Denmark (45.4%, a difference of 0.090%), and Immigrants from Bulgaria (45.5%, a difference of 0.15%). Similarly, the demographic groups most similar to Swedes are Australian (45.7%, a difference of 0.030%), Turkish (45.7%, a difference of 0.030%), Greek (45.6%, a difference of 0.070%), Czech (45.7%, a difference of 0.070%), and Immigrants from Singapore (45.6%, a difference of 0.11%).
| Demographics | Rating | Rank | Disability Age Over 75 |
| Macedonians | 99.9 /100 | #26 | Exceptional 45.4% |
| Immigrants | Poland | 99.9 /100 | #27 | Exceptional 45.4% |
| Thais | 99.9 /100 | #28 | Exceptional 45.4% |
| Filipinos | 99.9 /100 | #29 | Exceptional 45.4% |
| Immigrants | Denmark | 99.9 /100 | #30 | Exceptional 45.4% |
| Immigrants | Bulgaria | 99.9 /100 | #31 | Exceptional 45.5% |
| Immigrants | Australia | 99.9 /100 | #32 | Exceptional 45.5% |
| Immigrants | Croatia | 99.9 /100 | #33 | Exceptional 45.5% |
| Russians | 99.9 /100 | #34 | Exceptional 45.5% |
| Norwegians | 99.9 /100 | #35 | Exceptional 45.5% |
| Immigrants | Taiwan | 99.9 /100 | #36 | Exceptional 45.5% |
| South Africans | 99.9 /100 | #37 | Exceptional 45.5% |
| Italians | 99.9 /100 | #38 | Exceptional 45.6% |
| Estonians | 99.9 /100 | #39 | Exceptional 45.6% |
| Slovenes | 99.9 /100 | #40 | Exceptional 45.6% |
| Immigrants | Singapore | 99.8 /100 | #41 | Exceptional 45.6% |
| Greeks | 99.8 /100 | #42 | Exceptional 45.6% |
| Czechs | 99.8 /100 | #43 | Exceptional 45.7% |
| Australians | 99.8 /100 | #44 | Exceptional 45.7% |
| Turks | 99.8 /100 | #45 | Exceptional 45.7% |
| Swedes | 99.8 /100 | #46 | Exceptional 45.7% |