Immigrants from Poland vs Swedish 6th Grade
COMPARE
Immigrants from Poland
Swedish
6th Grade
6th Grade Comparison
Immigrants from Poland
Swedes
97.1%
6TH GRADE
56.2/ 100
METRIC RATING
165th/ 347
METRIC RANK
98.2%
6TH GRADE
100.0/ 100
METRIC RATING
10th/ 347
METRIC RANK
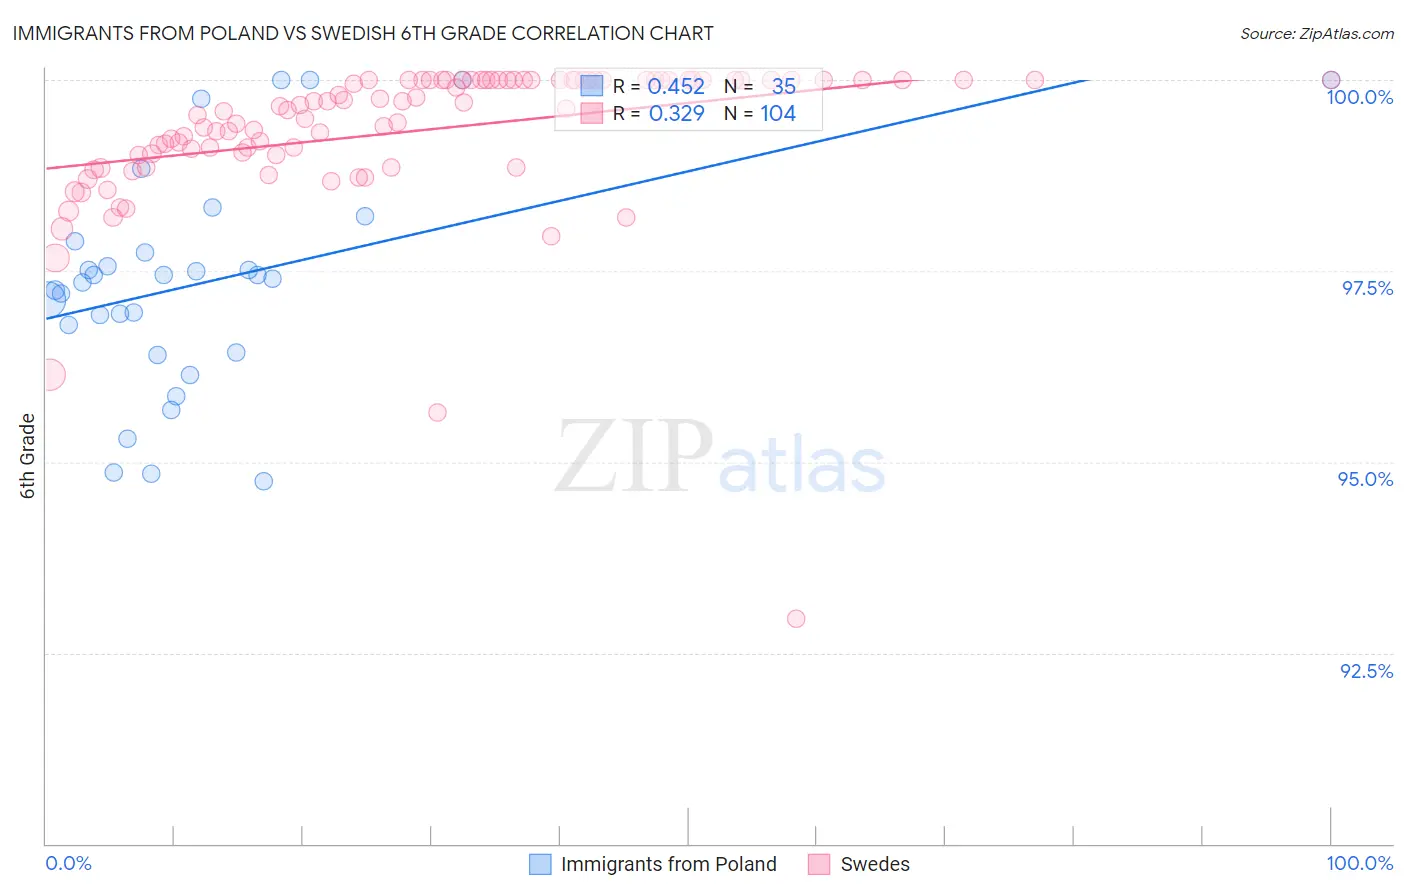
Immigrants from Poland vs Swedish 6th Grade Correlation Chart
The statistical analysis conducted on geographies consisting of 304,861,559 people shows a moderate positive correlation between the proportion of Immigrants from Poland and percentage of population with at least 6th grade education in the United States with a correlation coefficient (R) of 0.452 and weighted average of 97.1%. Similarly, the statistical analysis conducted on geographies consisting of 539,231,492 people shows a mild positive correlation between the proportion of Swedes and percentage of population with at least 6th grade education in the United States with a correlation coefficient (R) of 0.329 and weighted average of 98.2%, a difference of 1.1%.
6th Grade Correlation Summary
| Measurement | Immigrants from Poland | Swedish |
| Minimum | 94.8% | 92.9% |
| Maximum | 100.0% | 100.0% |
| Range | 5.2% | 7.1% |
| Mean | 97.4% | 99.3% |
| Median | 97.4% | 99.6% |
| Interquartile 25% (IQ1) | 96.4% | 99.0% |
| Interquartile 75% (IQ3) | 97.9% | 100.0% |
| Interquartile Range (IQR) | 1.5% | 0.98% |
| Standard Deviation (Sample) | 1.4% | 1.00% |
| Standard Deviation (Population) | 1.4% | 0.99% |
Similar Demographics by 6th Grade
Demographics Similar to Immigrants from Poland by 6th Grade
In terms of 6th grade, the demographic groups most similar to Immigrants from Poland are Albanian (97.1%, a difference of 0.010%), Immigrants from Korea (97.1%, a difference of 0.010%), Immigrants from Italy (97.1%, a difference of 0.010%), Apache (97.1%, a difference of 0.010%), and Immigrants from Taiwan (97.1%, a difference of 0.010%).
| Demographics | Rating | Rank | 6th Grade |
| Immigrants | Iran | 63.3 /100 | #158 | Good 97.1% |
| Kenyans | 62.9 /100 | #159 | Good 97.1% |
| Ugandans | 62.2 /100 | #160 | Good 97.1% |
| Immigrants | Belarus | 60.4 /100 | #161 | Good 97.1% |
| Marshallese | 60.2 /100 | #162 | Good 97.1% |
| Albanians | 57.8 /100 | #163 | Average 97.1% |
| Immigrants | Korea | 57.7 /100 | #164 | Average 97.1% |
| Immigrants | Poland | 56.2 /100 | #165 | Average 97.1% |
| Immigrants | Italy | 53.8 /100 | #166 | Average 97.1% |
| Apache | 53.6 /100 | #167 | Average 97.1% |
| Immigrants | Taiwan | 53.5 /100 | #168 | Average 97.1% |
| Bermudans | 52.6 /100 | #169 | Average 97.1% |
| Chileans | 52.1 /100 | #170 | Average 97.1% |
| Immigrants | Sri Lanka | 51.7 /100 | #171 | Average 97.1% |
| Egyptians | 50.9 /100 | #172 | Average 97.1% |
Demographics Similar to Swedes by 6th Grade
In terms of 6th grade, the demographic groups most similar to Swedes are English (98.1%, a difference of 0.010%), Alaskan Athabascan (98.1%, a difference of 0.020%), Slovene (98.2%, a difference of 0.030%), Tlingit-Haida (98.1%, a difference of 0.040%), and Carpatho Rusyn (98.1%, a difference of 0.050%).
| Demographics | Rating | Rank | 6th Grade |
| Welsh | 100.0 /100 | #3 | Exceptional 98.5% |
| Dutch | 100.0 /100 | #4 | Exceptional 98.4% |
| Tsimshian | 100.0 /100 | #5 | Exceptional 98.3% |
| Norwegians | 100.0 /100 | #6 | Exceptional 98.3% |
| Germans | 100.0 /100 | #7 | Exceptional 98.2% |
| Slovaks | 100.0 /100 | #8 | Exceptional 98.2% |
| Slovenes | 100.0 /100 | #9 | Exceptional 98.2% |
| Swedes | 100.0 /100 | #10 | Exceptional 98.2% |
| English | 100.0 /100 | #11 | Exceptional 98.1% |
| Alaskan Athabascans | 100.0 /100 | #12 | Exceptional 98.1% |
| Tlingit-Haida | 100.0 /100 | #13 | Exceptional 98.1% |
| Carpatho Rusyns | 100.0 /100 | #14 | Exceptional 98.1% |
| Inupiat | 100.0 /100 | #15 | Exceptional 98.1% |
| Scottish | 100.0 /100 | #16 | Exceptional 98.1% |
| Poles | 100.0 /100 | #17 | Exceptional 98.1% |