Immigrants from Poland vs Swedish Unemployment Among Seniors over 75 years
COMPARE
Immigrants from Poland
Swedish
Unemployment Among Seniors over 75 years
Unemployment Among Seniors over 75 years Comparison
Immigrants from Poland
Swedes
9.2%
UNEMPLOYMENT AMONG SENIORS OVER 75 YEARS
2.0/ 100
METRIC RATING
251st/ 347
METRIC RANK
10.0%
UNEMPLOYMENT AMONG SENIORS OVER 75 YEARS
0.0/ 100
METRIC RATING
305th/ 347
METRIC RANK
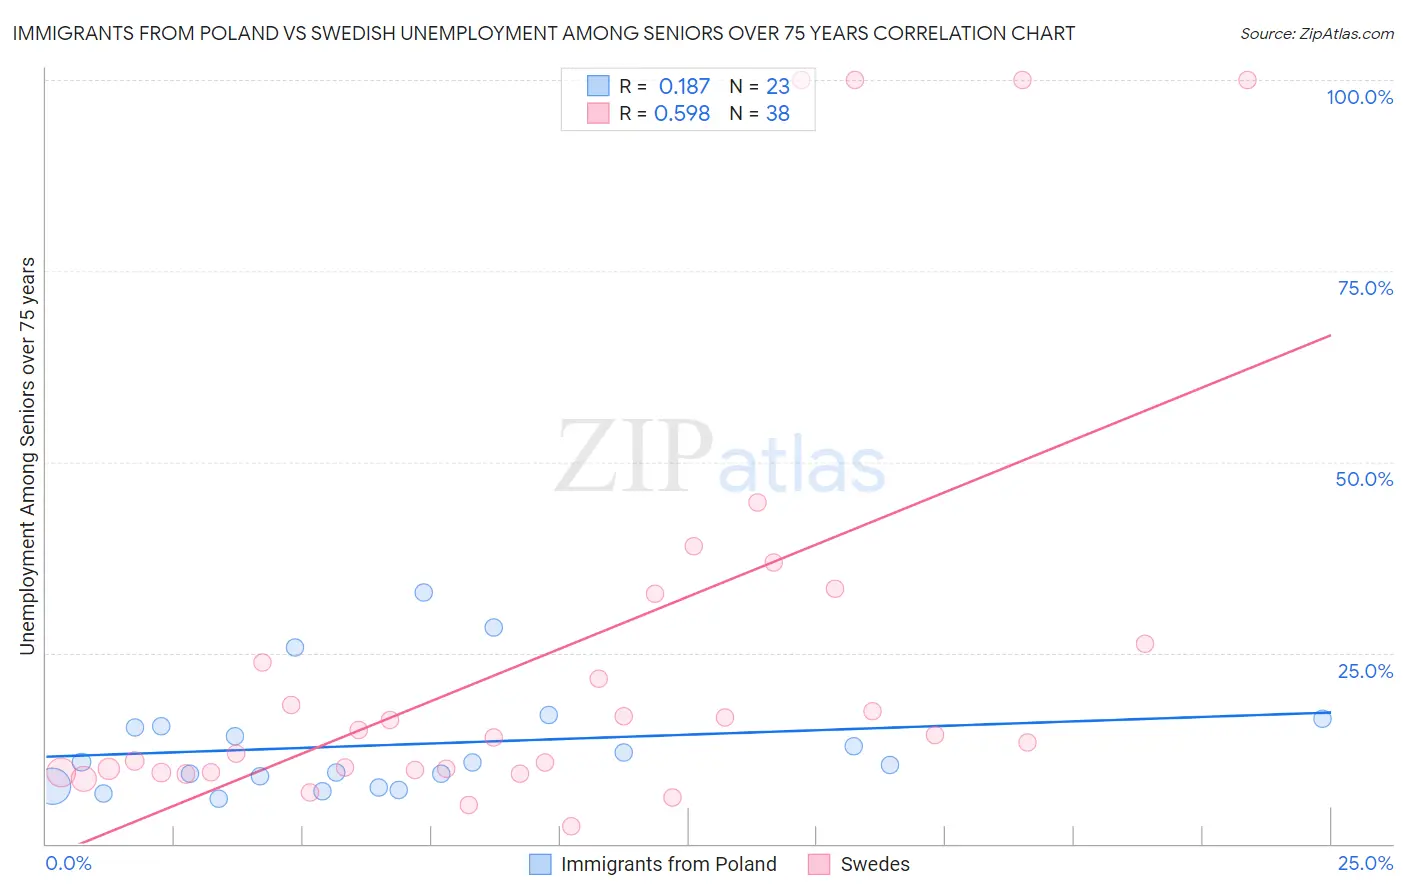
Immigrants from Poland vs Swedish Unemployment Among Seniors over 75 years Correlation Chart
The statistical analysis conducted on geographies consisting of 170,667,519 people shows a poor positive correlation between the proportion of Immigrants from Poland and unemployment rate among seniors over the age of 75 in the United States with a correlation coefficient (R) of 0.187 and weighted average of 9.2%. Similarly, the statistical analysis conducted on geographies consisting of 229,693,656 people shows a substantial positive correlation between the proportion of Swedes and unemployment rate among seniors over the age of 75 in the United States with a correlation coefficient (R) of 0.598 and weighted average of 10.0%, a difference of 8.6%.
Unemployment Among Seniors over 75 years Correlation Summary
| Measurement | Immigrants from Poland | Swedish |
| Minimum | 5.9% | 2.3% |
| Maximum | 32.9% | 100.0% |
| Range | 27.0% | 97.7% |
| Mean | 13.0% | 24.9% |
| Median | 10.6% | 14.1% |
| Interquartile 25% (IQ1) | 7.6% | 9.4% |
| Interquartile 75% (IQ3) | 15.4% | 26.2% |
| Interquartile Range (IQR) | 7.9% | 16.8% |
| Standard Deviation (Sample) | 7.2% | 27.9% |
| Standard Deviation (Population) | 7.0% | 27.5% |
Similar Demographics by Unemployment Among Seniors over 75 years
Demographics Similar to Immigrants from Poland by Unemployment Among Seniors over 75 years
In terms of unemployment among seniors over 75 years, the demographic groups most similar to Immigrants from Poland are Immigrants from Sudan (9.2%, a difference of 0.030%), Central American Indian (9.2%, a difference of 0.10%), Immigrants from Saudi Arabia (9.2%, a difference of 0.11%), Blackfeet (9.2%, a difference of 0.15%), and Pima (9.2%, a difference of 0.16%).
| Demographics | Rating | Rank | Unemployment Among Seniors over 75 years |
| Immigrants | Germany | 2.7 /100 | #244 | Tragic 9.2% |
| Immigrants | Canada | 2.6 /100 | #245 | Tragic 9.2% |
| Immigrants | North America | 2.4 /100 | #246 | Tragic 9.2% |
| Sub-Saharan Africans | 2.3 /100 | #247 | Tragic 9.2% |
| Blackfeet | 2.3 /100 | #248 | Tragic 9.2% |
| Immigrants | Saudi Arabia | 2.2 /100 | #249 | Tragic 9.2% |
| Central American Indians | 2.2 /100 | #250 | Tragic 9.2% |
| Immigrants | Poland | 2.0 /100 | #251 | Tragic 9.2% |
| Immigrants | Sudan | 2.0 /100 | #252 | Tragic 9.2% |
| Pima | 1.8 /100 | #253 | Tragic 9.2% |
| Immigrants | Ghana | 1.7 /100 | #254 | Tragic 9.2% |
| Immigrants | Scotland | 1.4 /100 | #255 | Tragic 9.2% |
| Brazilians | 1.3 /100 | #256 | Tragic 9.3% |
| Hawaiians | 1.2 /100 | #257 | Tragic 9.3% |
| Immigrants | England | 1.0 /100 | #258 | Tragic 9.3% |
Demographics Similar to Swedes by Unemployment Among Seniors over 75 years
In terms of unemployment among seniors over 75 years, the demographic groups most similar to Swedes are Italian (10.0%, a difference of 0.15%), Scotch-Irish (10.0%, a difference of 0.19%), Puget Sound Salish (10.0%, a difference of 0.20%), Finnish (10.0%, a difference of 0.27%), and Immigrants from Fiji (10.0%, a difference of 0.27%).
| Demographics | Rating | Rank | Unemployment Among Seniors over 75 years |
| Lithuanians | 0.0 /100 | #298 | Tragic 9.9% |
| Belgians | 0.0 /100 | #299 | Tragic 9.9% |
| Iraqis | 0.0 /100 | #300 | Tragic 9.9% |
| Welsh | 0.0 /100 | #301 | Tragic 10.0% |
| Finns | 0.0 /100 | #302 | Tragic 10.0% |
| Puget Sound Salish | 0.0 /100 | #303 | Tragic 10.0% |
| Scotch-Irish | 0.0 /100 | #304 | Tragic 10.0% |
| Swedes | 0.0 /100 | #305 | Tragic 10.0% |
| Italians | 0.0 /100 | #306 | Tragic 10.0% |
| Immigrants | Fiji | 0.0 /100 | #307 | Tragic 10.0% |
| Whites/Caucasians | 0.0 /100 | #308 | Tragic 10.1% |
| English | 0.0 /100 | #309 | Tragic 10.1% |
| Hungarians | 0.0 /100 | #310 | Tragic 10.1% |
| Scottish | 0.0 /100 | #311 | Tragic 10.1% |
| Chippewa | 0.0 /100 | #312 | Tragic 10.1% |