Immigrants from Poland vs Palestinian Poverty
COMPARE
Immigrants from Poland
Palestinian
Poverty
Poverty Comparison
Immigrants from Poland
Palestinians
10.8%
POVERTY
99.4/ 100
METRIC RATING
34th/ 347
METRIC RANK
11.6%
POVERTY
91.8/ 100
METRIC RATING
107th/ 347
METRIC RANK
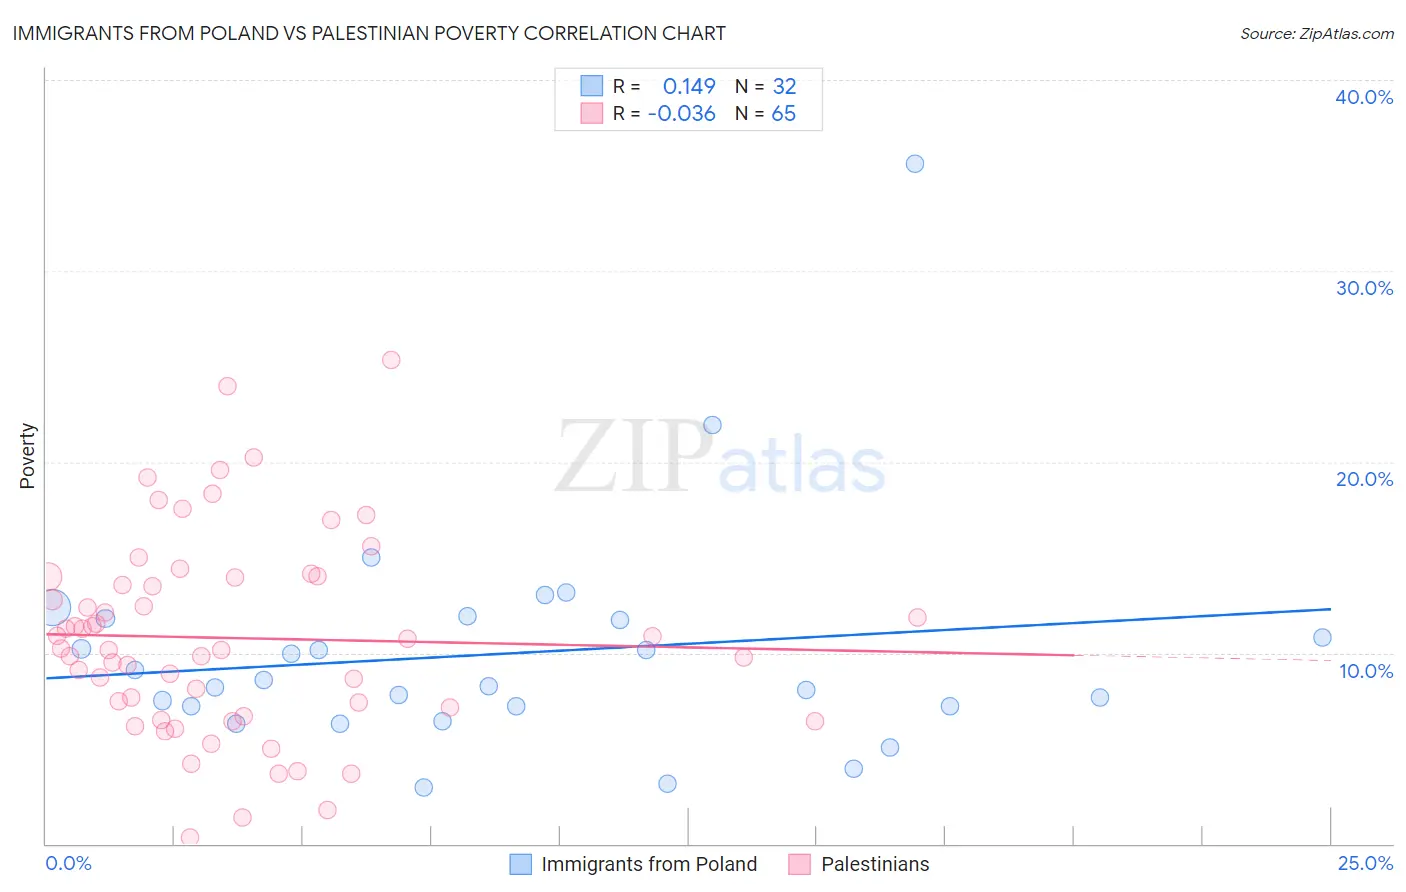
Immigrants from Poland vs Palestinian Poverty Correlation Chart
The statistical analysis conducted on geographies consisting of 304,760,939 people shows a poor positive correlation between the proportion of Immigrants from Poland and poverty level in the United States with a correlation coefficient (R) of 0.149 and weighted average of 10.8%. Similarly, the statistical analysis conducted on geographies consisting of 216,388,270 people shows no correlation between the proportion of Palestinians and poverty level in the United States with a correlation coefficient (R) of -0.036 and weighted average of 11.6%, a difference of 7.3%.
Poverty Correlation Summary
| Measurement | Immigrants from Poland | Palestinian |
| Minimum | 2.9% | 0.32% |
| Maximum | 35.6% | 25.3% |
| Range | 32.7% | 25.0% |
| Mean | 10.0% | 10.8% |
| Median | 8.4% | 10.2% |
| Interquartile 25% (IQ1) | 7.2% | 6.9% |
| Interquartile 75% (IQ3) | 11.8% | 14.0% |
| Interquartile Range (IQR) | 4.6% | 7.0% |
| Standard Deviation (Sample) | 6.0% | 5.2% |
| Standard Deviation (Population) | 5.9% | 5.2% |
Similar Demographics by Poverty
Demographics Similar to Immigrants from Poland by Poverty
In terms of poverty, the demographic groups most similar to Immigrants from Poland are Tongan (10.8%, a difference of 0.040%), Macedonian (10.8%, a difference of 0.090%), Cypriot (10.8%, a difference of 0.12%), Immigrants from Greece (10.8%, a difference of 0.22%), and Czech (10.8%, a difference of 0.26%).
| Demographics | Rating | Rank | Poverty |
| Immigrants | Northern Europe | 99.6 /100 | #27 | Exceptional 10.7% |
| Immigrants | Korea | 99.5 /100 | #28 | Exceptional 10.7% |
| Greeks | 99.5 /100 | #29 | Exceptional 10.7% |
| Danes | 99.5 /100 | #30 | Exceptional 10.7% |
| Poles | 99.5 /100 | #31 | Exceptional 10.7% |
| Iranians | 99.5 /100 | #32 | Exceptional 10.7% |
| Macedonians | 99.4 /100 | #33 | Exceptional 10.8% |
| Immigrants | Poland | 99.4 /100 | #34 | Exceptional 10.8% |
| Tongans | 99.4 /100 | #35 | Exceptional 10.8% |
| Cypriots | 99.3 /100 | #36 | Exceptional 10.8% |
| Immigrants | Greece | 99.3 /100 | #37 | Exceptional 10.8% |
| Czechs | 99.3 /100 | #38 | Exceptional 10.8% |
| Immigrants | Pakistan | 99.3 /100 | #39 | Exceptional 10.8% |
| Russians | 99.3 /100 | #40 | Exceptional 10.9% |
| Immigrants | Iran | 99.2 /100 | #41 | Exceptional 10.9% |
Demographics Similar to Palestinians by Poverty
In terms of poverty, the demographic groups most similar to Palestinians are Canadian (11.6%, a difference of 0.030%), Immigrants from Turkey (11.6%, a difference of 0.050%), Portuguese (11.6%, a difference of 0.090%), Immigrants from Zimbabwe (11.6%, a difference of 0.090%), and Welsh (11.6%, a difference of 0.090%).
| Demographics | Rating | Rank | Poverty |
| Scottish | 94.0 /100 | #100 | Exceptional 11.5% |
| Slavs | 93.3 /100 | #101 | Exceptional 11.5% |
| Laotians | 92.4 /100 | #102 | Exceptional 11.6% |
| Okinawans | 92.4 /100 | #103 | Exceptional 11.6% |
| Native Hawaiians | 92.1 /100 | #104 | Exceptional 11.6% |
| Portuguese | 92.1 /100 | #105 | Exceptional 11.6% |
| Immigrants | Zimbabwe | 92.1 /100 | #106 | Exceptional 11.6% |
| Palestinians | 91.8 /100 | #107 | Exceptional 11.6% |
| Canadians | 91.7 /100 | #108 | Exceptional 11.6% |
| Immigrants | Turkey | 91.7 /100 | #109 | Exceptional 11.6% |
| Welsh | 91.6 /100 | #110 | Exceptional 11.6% |
| French Canadians | 91.0 /100 | #111 | Exceptional 11.6% |
| Immigrants | Southern Europe | 90.8 /100 | #112 | Exceptional 11.6% |
| Immigrants | Belarus | 90.8 /100 | #113 | Exceptional 11.6% |
| Immigrants | China | 90.7 /100 | #114 | Exceptional 11.6% |