Immigrants from Poland vs Israeli Single Father Poverty
COMPARE
Immigrants from Poland
Israeli
Single Father Poverty
Single Father Poverty Comparison
Immigrants from Poland
Israelis
15.7%
SINGLE FATHER POVERTY
95.8/ 100
METRIC RATING
106th/ 347
METRIC RANK
16.8%
SINGLE FATHER POVERTY
4.6/ 100
METRIC RATING
229th/ 347
METRIC RANK
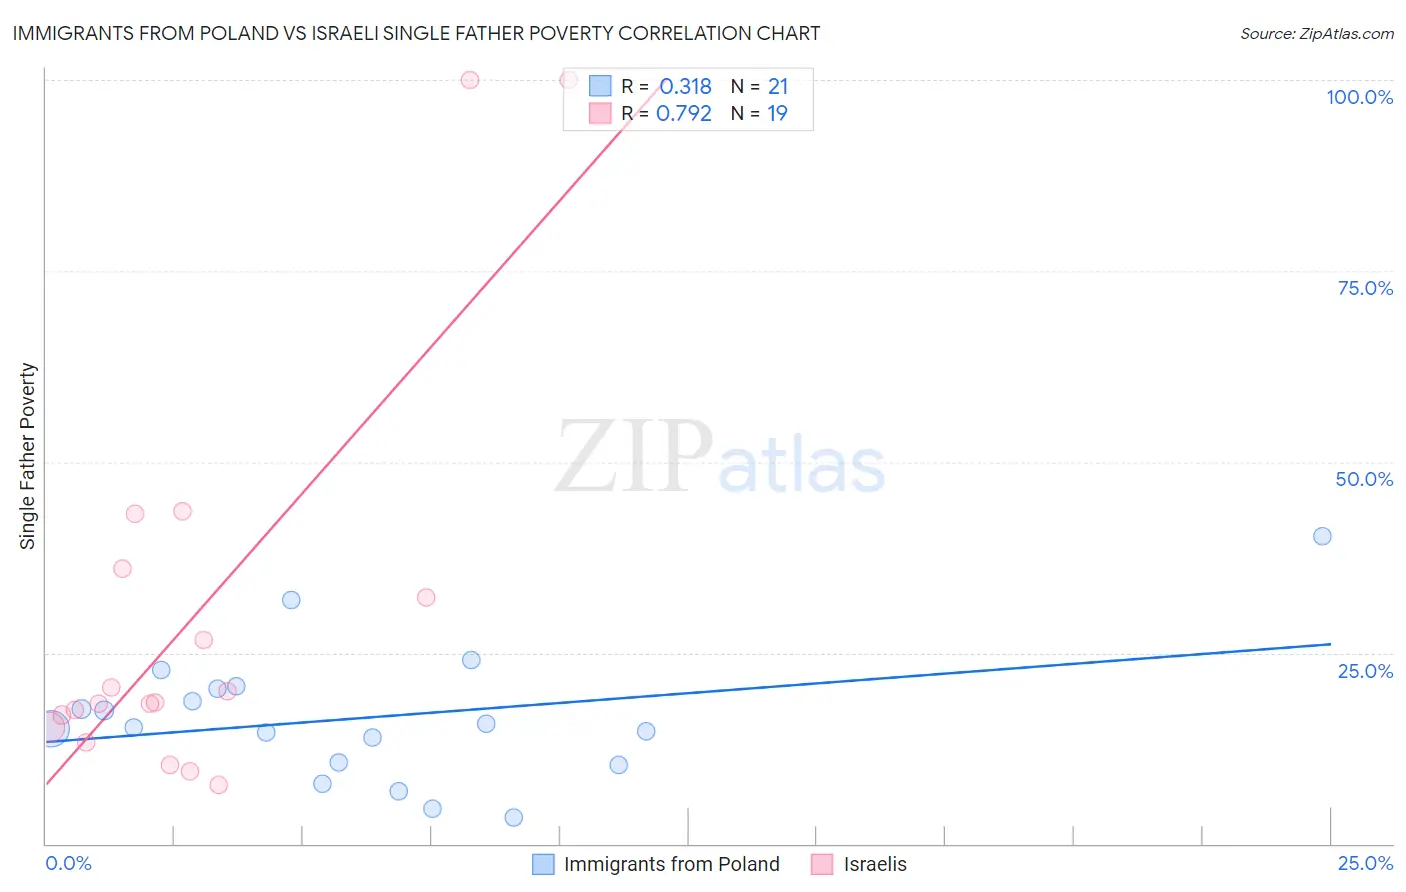
Immigrants from Poland vs Israeli Single Father Poverty Correlation Chart
The statistical analysis conducted on geographies consisting of 239,246,300 people shows a mild positive correlation between the proportion of Immigrants from Poland and poverty level among single fathers in the United States with a correlation coefficient (R) of 0.318 and weighted average of 15.7%. Similarly, the statistical analysis conducted on geographies consisting of 176,564,274 people shows a strong positive correlation between the proportion of Israelis and poverty level among single fathers in the United States with a correlation coefficient (R) of 0.792 and weighted average of 16.8%, a difference of 7.0%.
Single Father Poverty Correlation Summary
| Measurement | Immigrants from Poland | Israeli |
| Minimum | 3.5% | 7.8% |
| Maximum | 40.3% | 100.0% |
| Range | 36.8% | 92.2% |
| Mean | 16.5% | 29.9% |
| Median | 15.2% | 18.5% |
| Interquartile 25% (IQ1) | 10.5% | 15.2% |
| Interquartile 75% (IQ3) | 20.5% | 35.9% |
| Interquartile Range (IQR) | 10.0% | 20.7% |
| Standard Deviation (Sample) | 8.7% | 26.8% |
| Standard Deviation (Population) | 8.5% | 26.1% |
Similar Demographics by Single Father Poverty
Demographics Similar to Immigrants from Poland by Single Father Poverty
In terms of single father poverty, the demographic groups most similar to Immigrants from Poland are Native Hawaiian (15.7%, a difference of 0.020%), Pakistani (15.7%, a difference of 0.030%), Immigrants from Australia (15.7%, a difference of 0.070%), Australian (15.7%, a difference of 0.080%), and South American Indian (15.7%, a difference of 0.11%).
| Demographics | Rating | Rank | Single Father Poverty |
| Immigrants | Middle Africa | 97.4 /100 | #99 | Exceptional 15.6% |
| Immigrants | Chile | 96.9 /100 | #100 | Exceptional 15.7% |
| Fijians | 96.8 /100 | #101 | Exceptional 15.7% |
| Chileans | 96.4 /100 | #102 | Exceptional 15.7% |
| South American Indians | 96.2 /100 | #103 | Exceptional 15.7% |
| Australians | 96.1 /100 | #104 | Exceptional 15.7% |
| Immigrants | Australia | 96.1 /100 | #105 | Exceptional 15.7% |
| Immigrants | Poland | 95.8 /100 | #106 | Exceptional 15.7% |
| Native Hawaiians | 95.8 /100 | #107 | Exceptional 15.7% |
| Pakistanis | 95.7 /100 | #108 | Exceptional 15.7% |
| Turks | 95.1 /100 | #109 | Exceptional 15.8% |
| Immigrants | Africa | 95.1 /100 | #110 | Exceptional 15.8% |
| Bulgarians | 94.8 /100 | #111 | Exceptional 15.8% |
| Immigrants | Latvia | 94.7 /100 | #112 | Exceptional 15.8% |
| Danes | 94.5 /100 | #113 | Exceptional 15.8% |
Demographics Similar to Israelis by Single Father Poverty
In terms of single father poverty, the demographic groups most similar to Israelis are Immigrants from Trinidad and Tobago (16.8%, a difference of 0.030%), Belgian (16.8%, a difference of 0.16%), British (16.8%, a difference of 0.22%), Spanish American (16.9%, a difference of 0.24%), and Immigrants from Grenada (16.9%, a difference of 0.26%).
| Demographics | Rating | Rank | Single Father Poverty |
| Immigrants | Spain | 8.0 /100 | #222 | Tragic 16.7% |
| Immigrants | Austria | 7.0 /100 | #223 | Tragic 16.8% |
| Immigrants | Norway | 6.5 /100 | #224 | Tragic 16.8% |
| Menominee | 6.4 /100 | #225 | Tragic 16.8% |
| Hispanics or Latinos | 6.1 /100 | #226 | Tragic 16.8% |
| British | 5.6 /100 | #227 | Tragic 16.8% |
| Belgians | 5.3 /100 | #228 | Tragic 16.8% |
| Israelis | 4.6 /100 | #229 | Tragic 16.8% |
| Immigrants | Trinidad and Tobago | 4.5 /100 | #230 | Tragic 16.8% |
| Spanish Americans | 3.7 /100 | #231 | Tragic 16.9% |
| Immigrants | Grenada | 3.7 /100 | #232 | Tragic 16.9% |
| Senegalese | 3.2 /100 | #233 | Tragic 16.9% |
| Marshallese | 3.1 /100 | #234 | Tragic 16.9% |
| Immigrants | Western Europe | 2.9 /100 | #235 | Tragic 16.9% |
| Immigrants | Germany | 2.9 /100 | #236 | Tragic 16.9% |