Immigrants from Nigeria vs Israeli Single Female Poverty
COMPARE
Immigrants from Nigeria
Israeli
Single Female Poverty
Single Female Poverty Comparison
Immigrants from Nigeria
Israelis
21.2%
SINGLE FEMALE POVERTY
36.8/ 100
METRIC RATING
187th/ 347
METRIC RANK
19.9%
SINGLE FEMALE POVERTY
96.9/ 100
METRIC RATING
105th/ 347
METRIC RANK
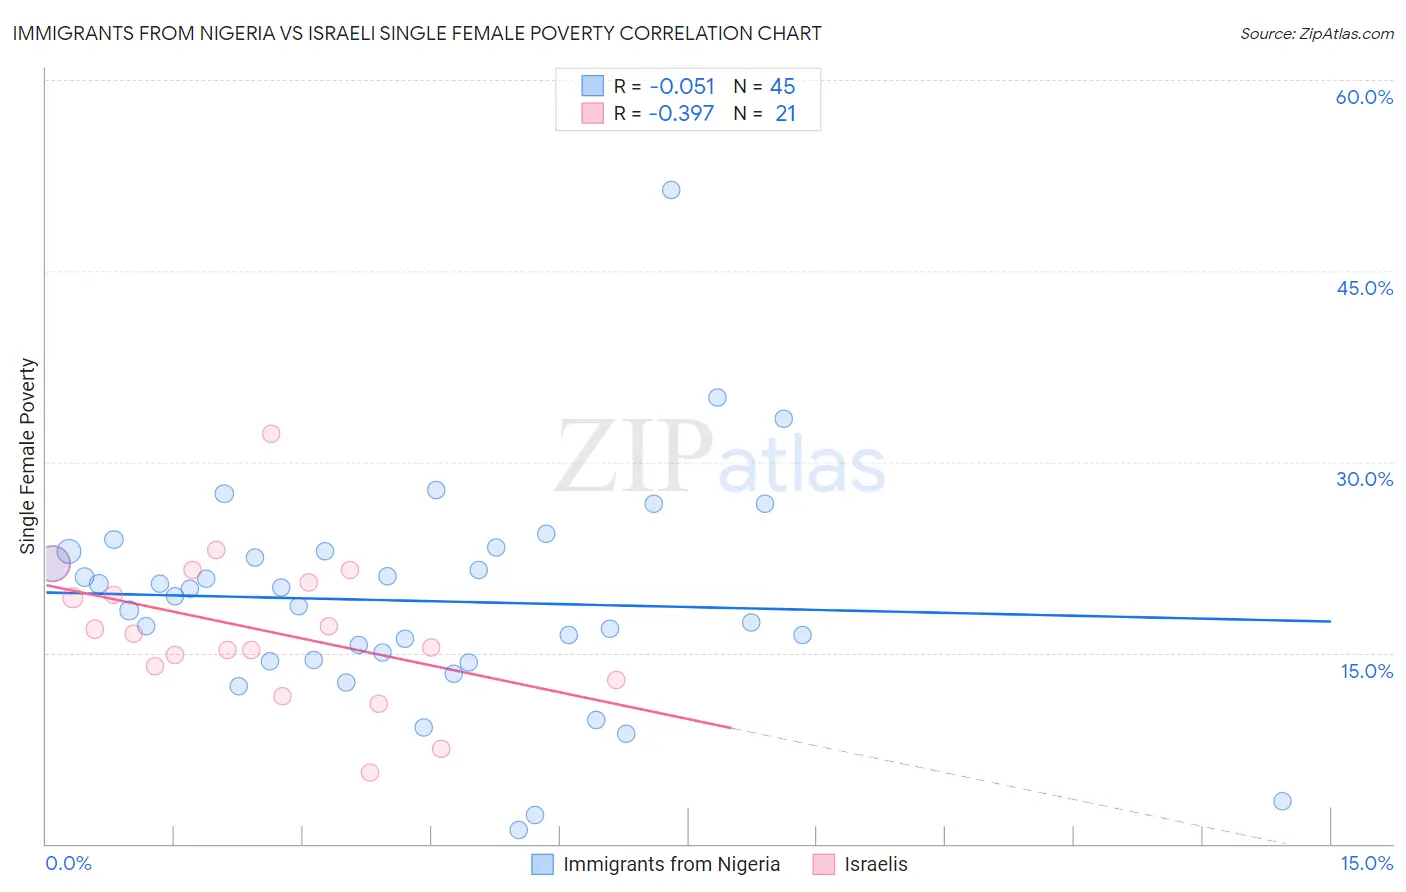
Immigrants from Nigeria vs Israeli Single Female Poverty Correlation Chart
The statistical analysis conducted on geographies consisting of 281,424,255 people shows a slight negative correlation between the proportion of Immigrants from Nigeria and poverty level among single females in the United States with a correlation coefficient (R) of -0.051 and weighted average of 21.2%. Similarly, the statistical analysis conducted on geographies consisting of 208,686,807 people shows a mild negative correlation between the proportion of Israelis and poverty level among single females in the United States with a correlation coefficient (R) of -0.397 and weighted average of 19.9%, a difference of 6.5%.
Single Female Poverty Correlation Summary
| Measurement | Immigrants from Nigeria | Israeli |
| Minimum | 1.1% | 5.6% |
| Maximum | 51.4% | 32.2% |
| Range | 50.2% | 26.6% |
| Mean | 19.1% | 16.8% |
| Median | 19.4% | 16.5% |
| Interquartile 25% (IQ1) | 14.4% | 13.4% |
| Interquartile 75% (IQ3) | 23.0% | 21.0% |
| Interquartile Range (IQR) | 8.6% | 7.6% |
| Standard Deviation (Sample) | 8.7% | 5.8% |
| Standard Deviation (Population) | 8.6% | 5.7% |
Similar Demographics by Single Female Poverty
Demographics Similar to Immigrants from Nigeria by Single Female Poverty
In terms of single female poverty, the demographic groups most similar to Immigrants from Nigeria are Hawaiian (21.2%, a difference of 0.060%), Yugoslavian (21.2%, a difference of 0.090%), Immigrants from Cambodia (21.2%, a difference of 0.10%), Immigrants from Cuba (21.2%, a difference of 0.10%), and Trinidadian and Tobagonian (21.2%, a difference of 0.10%).
| Demographics | Rating | Rank | Single Female Poverty |
| Spanish American Indians | 42.5 /100 | #180 | Average 21.1% |
| Europeans | 42.3 /100 | #181 | Average 21.1% |
| Slavs | 40.5 /100 | #182 | Average 21.1% |
| Slovaks | 39.7 /100 | #183 | Fair 21.1% |
| Hungarians | 39.6 /100 | #184 | Fair 21.1% |
| Immigrants | Cambodia | 38.2 /100 | #185 | Fair 21.2% |
| Hawaiians | 37.7 /100 | #186 | Fair 21.2% |
| Immigrants | Nigeria | 36.8 /100 | #187 | Fair 21.2% |
| Yugoslavians | 35.4 /100 | #188 | Fair 21.2% |
| Immigrants | Cuba | 35.3 /100 | #189 | Fair 21.2% |
| Trinidadians and Tobagonians | 35.2 /100 | #190 | Fair 21.2% |
| Immigrants | Germany | 31.1 /100 | #191 | Fair 21.3% |
| Immigrants | Jamaica | 30.5 /100 | #192 | Fair 21.3% |
| Basques | 28.1 /100 | #193 | Fair 21.3% |
| Czechoslovakians | 27.7 /100 | #194 | Fair 21.3% |
Demographics Similar to Israelis by Single Female Poverty
In terms of single female poverty, the demographic groups most similar to Israelis are Chilean (19.9%, a difference of 0.010%), Ethiopian (19.9%, a difference of 0.090%), Immigrants from Syria (19.9%, a difference of 0.11%), Immigrants from Southern Europe (19.9%, a difference of 0.13%), and Native Hawaiian (19.9%, a difference of 0.16%).
| Demographics | Rating | Rank | Single Female Poverty |
| Immigrants | France | 97.9 /100 | #98 | Exceptional 19.7% |
| Sierra Leoneans | 97.9 /100 | #99 | Exceptional 19.7% |
| Ukrainians | 97.6 /100 | #100 | Exceptional 19.8% |
| Immigrants | Belgium | 97.3 /100 | #101 | Exceptional 19.8% |
| Immigrants | Cameroon | 97.3 /100 | #102 | Exceptional 19.8% |
| Immigrants | Southern Europe | 97.1 /100 | #103 | Exceptional 19.9% |
| Chileans | 96.9 /100 | #104 | Exceptional 19.9% |
| Israelis | 96.9 /100 | #105 | Exceptional 19.9% |
| Ethiopians | 96.7 /100 | #106 | Exceptional 19.9% |
| Immigrants | Syria | 96.7 /100 | #107 | Exceptional 19.9% |
| Native Hawaiians | 96.6 /100 | #108 | Exceptional 19.9% |
| Colombians | 96.6 /100 | #109 | Exceptional 19.9% |
| Immigrants | Western Asia | 96.5 /100 | #110 | Exceptional 19.9% |
| Carpatho Rusyns | 96.1 /100 | #111 | Exceptional 20.0% |
| Immigrants | Netherlands | 96.0 /100 | #112 | Exceptional 20.0% |