Immigrants from Norway vs Immigrants from Sudan In Labor Force | Age 25-29
COMPARE
Immigrants from Norway
Immigrants from Sudan
In Labor Force | Age 25-29
In Labor Force | Age 25-29 Comparison
Immigrants from Norway
Immigrants from Sudan
84.6%
IN LABOR FORCE | AGE 25-29
41.9/ 100
METRIC RATING
181st/ 347
METRIC RANK
85.1%
IN LABOR FORCE | AGE 25-29
94.3/ 100
METRIC RATING
97th/ 347
METRIC RANK
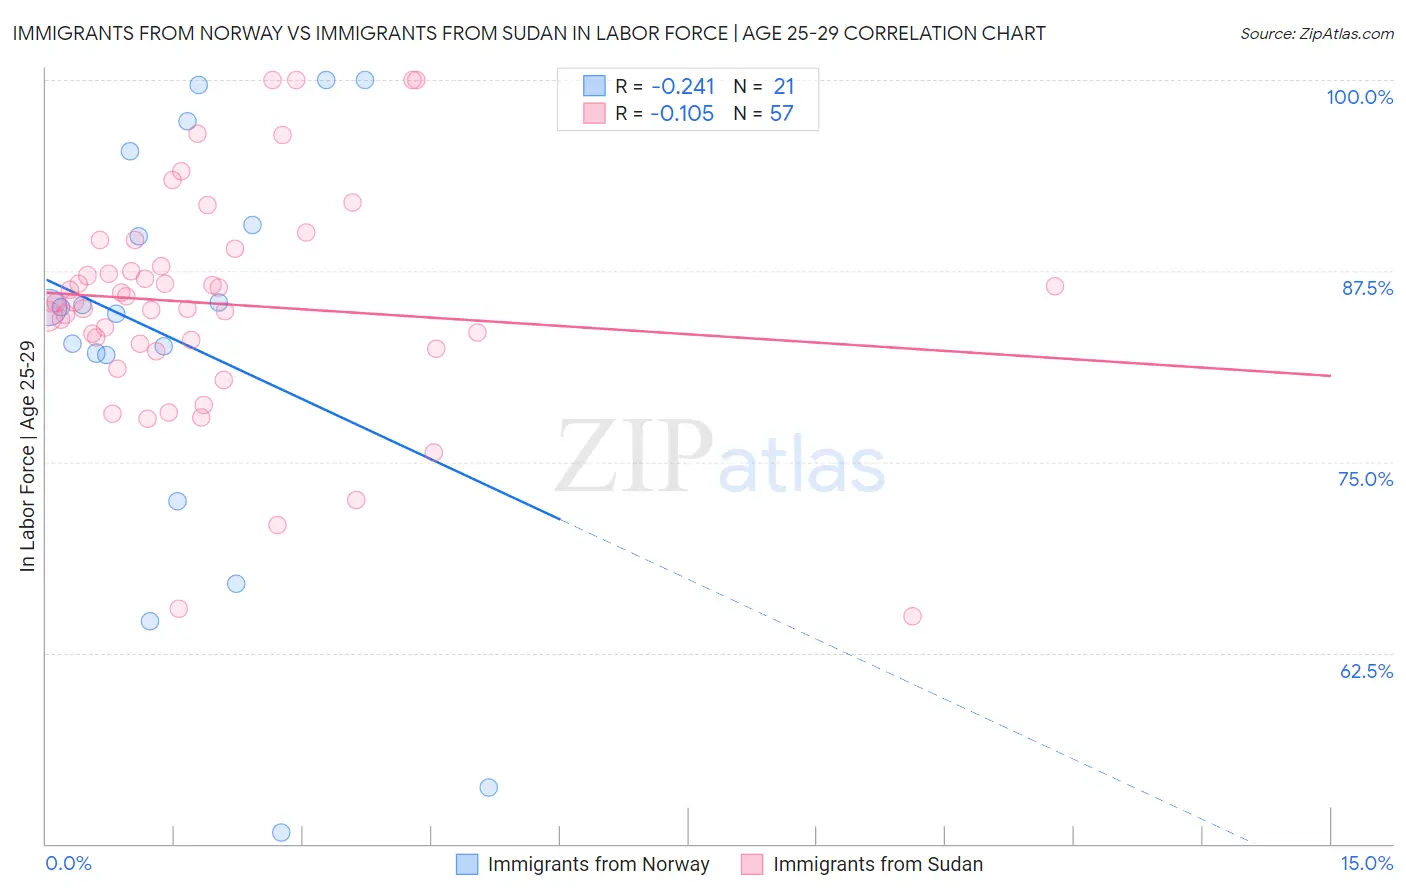
Immigrants from Norway vs Immigrants from Sudan In Labor Force | Age 25-29 Correlation Chart
The statistical analysis conducted on geographies consisting of 116,700,370 people shows a weak negative correlation between the proportion of Immigrants from Norway and labor force participation rate among population between the ages 25 and 29 in the United States with a correlation coefficient (R) of -0.241 and weighted average of 84.6%. Similarly, the statistical analysis conducted on geographies consisting of 118,966,602 people shows a poor negative correlation between the proportion of Immigrants from Sudan and labor force participation rate among population between the ages 25 and 29 in the United States with a correlation coefficient (R) of -0.105 and weighted average of 85.1%, a difference of 0.58%.
In Labor Force | Age 25-29 Correlation Summary
| Measurement | Immigrants from Norway | Immigrants from Sudan |
| Minimum | 50.7% | 64.9% |
| Maximum | 100.0% | 100.0% |
| Range | 49.3% | 35.1% |
| Mean | 82.7% | 85.4% |
| Median | 85.1% | 85.5% |
| Interquartile 25% (IQ1) | 77.2% | 82.6% |
| Interquartile 75% (IQ3) | 92.9% | 88.3% |
| Interquartile Range (IQR) | 15.7% | 5.8% |
| Standard Deviation (Sample) | 14.1% | 7.4% |
| Standard Deviation (Population) | 13.7% | 7.3% |
Similar Demographics by In Labor Force | Age 25-29
Demographics Similar to Immigrants from Norway by In Labor Force | Age 25-29
In terms of in labor force | age 25-29, the demographic groups most similar to Immigrants from Norway are Immigrants from South America (84.6%, a difference of 0.010%), European (84.6%, a difference of 0.010%), Scottish (84.6%, a difference of 0.010%), Immigrants from Argentina (84.6%, a difference of 0.020%), and Immigrants from China (84.6%, a difference of 0.030%).
| Demographics | Rating | Rank | In Labor Force | Age 25-29 |
| Palestinians | 50.0 /100 | #174 | Average 84.7% |
| Hungarians | 47.8 /100 | #175 | Average 84.6% |
| Malaysians | 46.8 /100 | #176 | Average 84.6% |
| Immigrants | China | 45.7 /100 | #177 | Average 84.6% |
| Immigrants | Thailand | 45.2 /100 | #178 | Average 84.6% |
| Immigrants | Argentina | 44.0 /100 | #179 | Average 84.6% |
| Immigrants | South America | 42.9 /100 | #180 | Average 84.6% |
| Immigrants | Norway | 41.9 /100 | #181 | Average 84.6% |
| Europeans | 40.3 /100 | #182 | Average 84.6% |
| Scottish | 40.1 /100 | #183 | Average 84.6% |
| Immigrants | Kuwait | 38.2 /100 | #184 | Fair 84.6% |
| Immigrants | Denmark | 37.0 /100 | #185 | Fair 84.6% |
| Immigrants | Belgium | 35.0 /100 | #186 | Fair 84.6% |
| Immigrants | Portugal | 34.7 /100 | #187 | Fair 84.6% |
| Immigrants | Ukraine | 33.7 /100 | #188 | Fair 84.5% |
Demographics Similar to Immigrants from Sudan by In Labor Force | Age 25-29
In terms of in labor force | age 25-29, the demographic groups most similar to Immigrants from Sudan are Immigrants from Netherlands (85.1%, a difference of 0.010%), Immigrants from Romania (85.1%, a difference of 0.010%), Mongolian (85.1%, a difference of 0.010%), Bangladeshi (85.1%, a difference of 0.010%), and Immigrants from Switzerland (85.1%, a difference of 0.010%).
| Demographics | Rating | Rank | In Labor Force | Age 25-29 |
| Burmese | 95.9 /100 | #90 | Exceptional 85.1% |
| Immigrants | Moldova | 95.8 /100 | #91 | Exceptional 85.1% |
| Immigrants | Costa Rica | 95.5 /100 | #92 | Exceptional 85.1% |
| Austrians | 95.3 /100 | #93 | Exceptional 85.1% |
| Immigrants | Korea | 94.8 /100 | #94 | Exceptional 85.1% |
| Immigrants | Netherlands | 94.6 /100 | #95 | Exceptional 85.1% |
| Immigrants | Romania | 94.6 /100 | #96 | Exceptional 85.1% |
| Immigrants | Sudan | 94.3 /100 | #97 | Exceptional 85.1% |
| Mongolians | 94.1 /100 | #98 | Exceptional 85.1% |
| Bangladeshis | 94.0 /100 | #99 | Exceptional 85.1% |
| Immigrants | Switzerland | 93.9 /100 | #100 | Exceptional 85.1% |
| Egyptians | 93.8 /100 | #101 | Exceptional 85.1% |
| Slavs | 93.7 /100 | #102 | Exceptional 85.1% |
| Immigrants | Japan | 93.5 /100 | #103 | Exceptional 85.1% |
| Immigrants | Zaire | 93.3 /100 | #104 | Exceptional 85.1% |