Venezuelan vs Immigrants from Sudan Child Poverty Under the Age of 5
COMPARE
Venezuelan
Immigrants from Sudan
Child Poverty Under the Age of 5
Child Poverty Under the Age of 5 Comparison
Venezuelans
Immigrants from Sudan
16.8%
CHILD POVERTY UNDER THE AGE OF 5
73.7/ 100
METRIC RATING
157th/ 347
METRIC RANK
19.2%
CHILD POVERTY UNDER THE AGE OF 5
1.3/ 100
METRIC RATING
228th/ 347
METRIC RANK
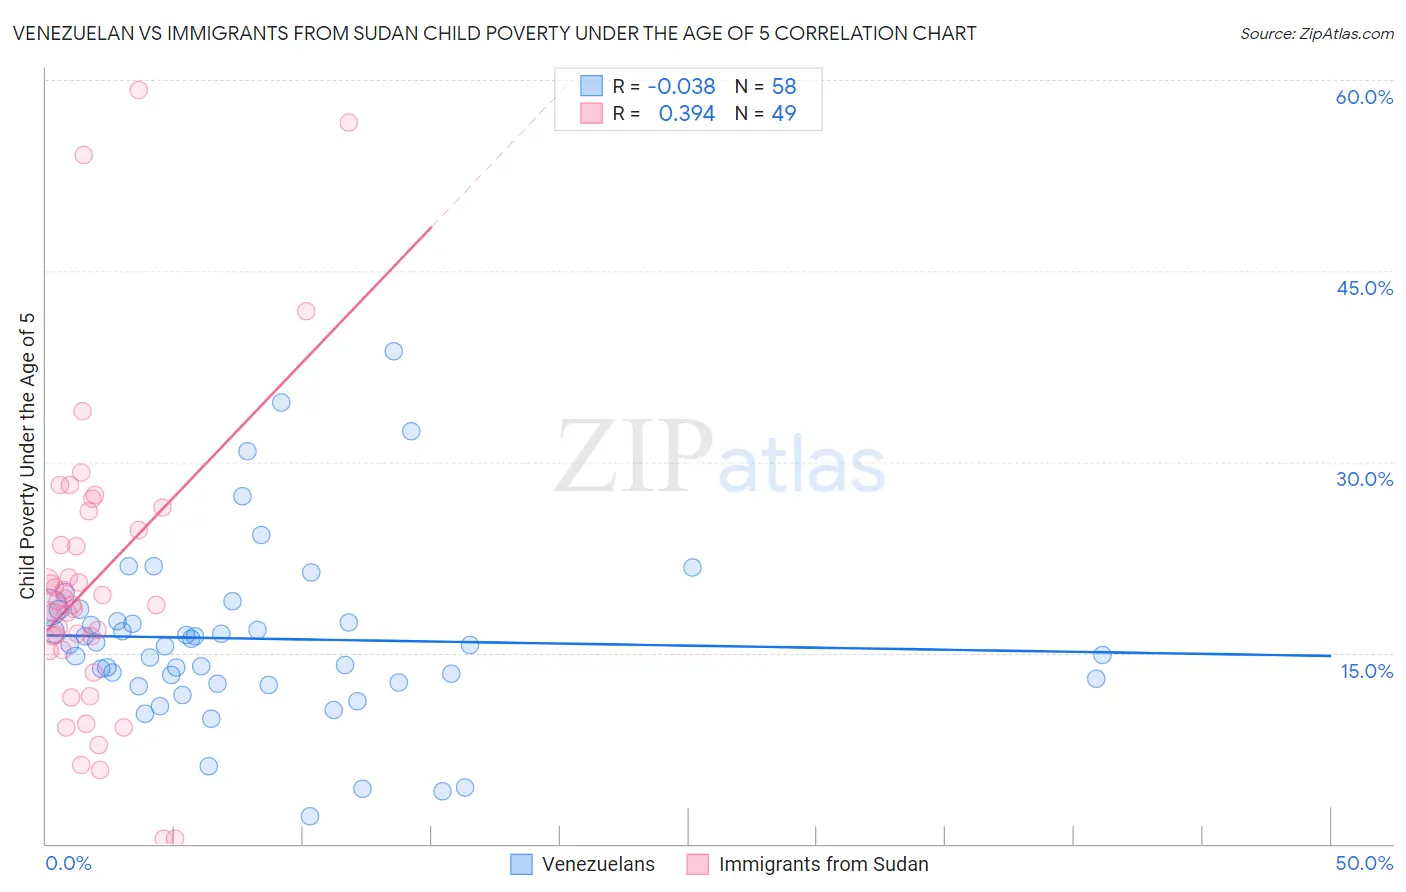
Venezuelan vs Immigrants from Sudan Child Poverty Under the Age of 5 Correlation Chart
The statistical analysis conducted on geographies consisting of 297,331,987 people shows no correlation between the proportion of Venezuelans and poverty level among children under the age of 5 in the United States with a correlation coefficient (R) of -0.038 and weighted average of 16.8%. Similarly, the statistical analysis conducted on geographies consisting of 117,972,836 people shows a mild positive correlation between the proportion of Immigrants from Sudan and poverty level among children under the age of 5 in the United States with a correlation coefficient (R) of 0.394 and weighted average of 19.2%, a difference of 14.4%.
Child Poverty Under the Age of 5 Correlation Summary
| Measurement | Venezuelan | Immigrants from Sudan |
| Minimum | 2.1% | 0.35% |
| Maximum | 38.7% | 59.2% |
| Range | 36.6% | 58.9% |
| Mean | 16.1% | 20.7% |
| Median | 15.7% | 18.8% |
| Interquartile 25% (IQ1) | 12.7% | 15.2% |
| Interquartile 75% (IQ3) | 18.4% | 25.4% |
| Interquartile Range (IQR) | 5.7% | 10.2% |
| Standard Deviation (Sample) | 6.9% | 12.2% |
| Standard Deviation (Population) | 6.8% | 12.1% |
Similar Demographics by Child Poverty Under the Age of 5
Demographics Similar to Venezuelans by Child Poverty Under the Age of 5
In terms of child poverty under the age of 5, the demographic groups most similar to Venezuelans are Afghan (16.8%, a difference of 0.090%), Czechoslovakian (16.8%, a difference of 0.16%), South American (16.7%, a difference of 0.19%), Immigrants from Syria (16.8%, a difference of 0.20%), and Irish (16.8%, a difference of 0.23%).
| Demographics | Rating | Rank | Child Poverty Under the Age of 5 |
| Colombians | 77.8 /100 | #150 | Good 16.7% |
| Canadians | 77.6 /100 | #151 | Good 16.7% |
| Belgians | 77.2 /100 | #152 | Good 16.7% |
| Dutch | 77.1 /100 | #153 | Good 16.7% |
| Immigrants | Venezuela | 76.0 /100 | #154 | Good 16.7% |
| South Americans | 75.1 /100 | #155 | Good 16.7% |
| Afghans | 74.4 /100 | #156 | Good 16.8% |
| Venezuelans | 73.7 /100 | #157 | Good 16.8% |
| Czechoslovakians | 72.5 /100 | #158 | Good 16.8% |
| Immigrants | Syria | 72.3 /100 | #159 | Good 16.8% |
| Irish | 72.0 /100 | #160 | Good 16.8% |
| English | 70.4 /100 | #161 | Good 16.8% |
| Costa Ricans | 69.8 /100 | #162 | Good 16.9% |
| Scottish | 68.6 /100 | #163 | Good 16.9% |
| Immigrants | Oceania | 67.6 /100 | #164 | Good 16.9% |
Demographics Similar to Immigrants from Sudan by Child Poverty Under the Age of 5
In terms of child poverty under the age of 5, the demographic groups most similar to Immigrants from Sudan are Ghanaian (19.2%, a difference of 0.080%), Ecuadorian (19.2%, a difference of 0.12%), Bermudan (19.2%, a difference of 0.17%), Cape Verdean (19.1%, a difference of 0.30%), and Immigrants from Eritrea (19.1%, a difference of 0.49%).
| Demographics | Rating | Rank | Child Poverty Under the Age of 5 |
| Immigrants | Nigeria | 2.1 /100 | #221 | Tragic 19.0% |
| Alsatians | 1.7 /100 | #222 | Tragic 19.1% |
| Cubans | 1.7 /100 | #223 | Tragic 19.1% |
| Nicaraguans | 1.6 /100 | #224 | Tragic 19.1% |
| Nigerians | 1.6 /100 | #225 | Tragic 19.1% |
| Immigrants | Eritrea | 1.5 /100 | #226 | Tragic 19.1% |
| Cape Verdeans | 1.4 /100 | #227 | Tragic 19.1% |
| Immigrants | Sudan | 1.3 /100 | #228 | Tragic 19.2% |
| Ghanaians | 1.2 /100 | #229 | Tragic 19.2% |
| Ecuadorians | 1.2 /100 | #230 | Tragic 19.2% |
| Bermudans | 1.2 /100 | #231 | Tragic 19.2% |
| Trinidadians and Tobagonians | 0.9 /100 | #232 | Tragic 19.3% |
| Sudanese | 0.9 /100 | #233 | Tragic 19.3% |
| Immigrants | Micronesia | 0.9 /100 | #234 | Tragic 19.4% |
| Immigrants | Laos | 0.8 /100 | #235 | Tragic 19.4% |