Immigrants from Croatia vs Immigrants from Sudan Child Poverty Under the Age of 5
COMPARE
Immigrants from Croatia
Immigrants from Sudan
Child Poverty Under the Age of 5
Child Poverty Under the Age of 5 Comparison
Immigrants from Croatia
Immigrants from Sudan
15.6%
CHILD POVERTY UNDER THE AGE OF 5
97.3/ 100
METRIC RATING
89th/ 347
METRIC RANK
19.2%
CHILD POVERTY UNDER THE AGE OF 5
1.3/ 100
METRIC RATING
228th/ 347
METRIC RANK
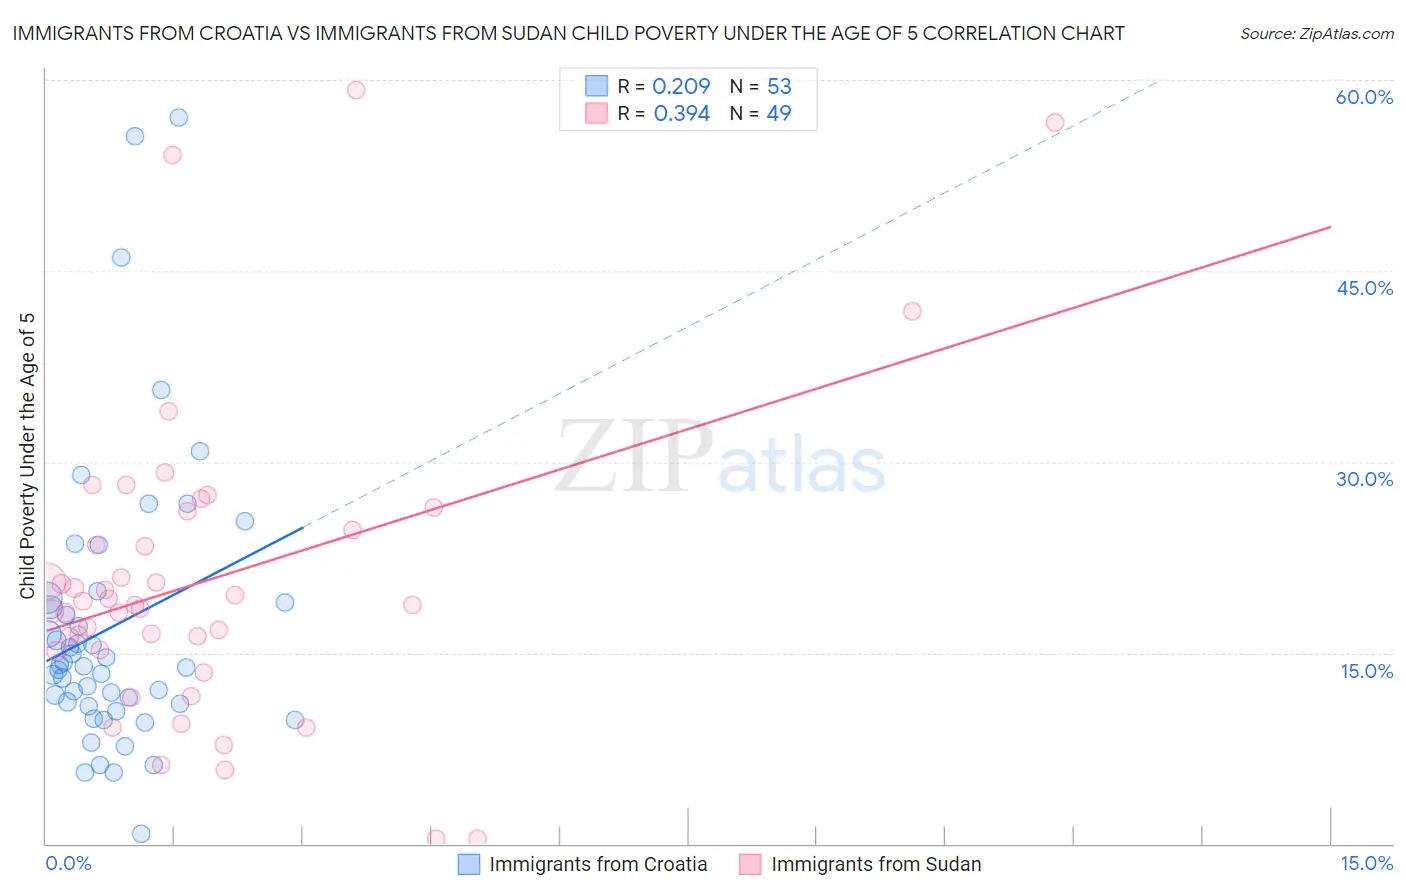
Immigrants from Croatia vs Immigrants from Sudan Child Poverty Under the Age of 5 Correlation Chart
The statistical analysis conducted on geographies consisting of 129,139,038 people shows a weak positive correlation between the proportion of Immigrants from Croatia and poverty level among children under the age of 5 in the United States with a correlation coefficient (R) of 0.209 and weighted average of 15.6%. Similarly, the statistical analysis conducted on geographies consisting of 117,972,836 people shows a mild positive correlation between the proportion of Immigrants from Sudan and poverty level among children under the age of 5 in the United States with a correlation coefficient (R) of 0.394 and weighted average of 19.2%, a difference of 22.7%.
Child Poverty Under the Age of 5 Correlation Summary
| Measurement | Immigrants from Croatia | Immigrants from Sudan |
| Minimum | 0.81% | 0.35% |
| Maximum | 57.0% | 59.2% |
| Range | 56.2% | 58.9% |
| Mean | 17.0% | 20.7% |
| Median | 14.0% | 18.8% |
| Interquartile 25% (IQ1) | 10.9% | 15.2% |
| Interquartile 75% (IQ3) | 19.1% | 25.4% |
| Interquartile Range (IQR) | 8.3% | 10.2% |
| Standard Deviation (Sample) | 11.2% | 12.2% |
| Standard Deviation (Population) | 11.1% | 12.1% |
Similar Demographics by Child Poverty Under the Age of 5
Demographics Similar to Immigrants from Croatia by Child Poverty Under the Age of 5
In terms of child poverty under the age of 5, the demographic groups most similar to Immigrants from Croatia are Immigrants from France (15.6%, a difference of 0.0%), Jordanian (15.6%, a difference of 0.060%), Polish (15.7%, a difference of 0.11%), Immigrants from Vietnam (15.6%, a difference of 0.12%), and Scandinavian (15.7%, a difference of 0.18%).
| Demographics | Rating | Rank | Child Poverty Under the Age of 5 |
| Immigrants | Italy | 97.7 /100 | #82 | Exceptional 15.6% |
| Chileans | 97.6 /100 | #83 | Exceptional 15.6% |
| Immigrants | Netherlands | 97.6 /100 | #84 | Exceptional 15.6% |
| Immigrants | Latvia | 97.4 /100 | #85 | Exceptional 15.6% |
| Immigrants | Malaysia | 97.4 /100 | #86 | Exceptional 15.6% |
| Immigrants | Vietnam | 97.4 /100 | #87 | Exceptional 15.6% |
| Jordanians | 97.3 /100 | #88 | Exceptional 15.6% |
| Immigrants | Croatia | 97.3 /100 | #89 | Exceptional 15.6% |
| Immigrants | France | 97.3 /100 | #90 | Exceptional 15.6% |
| Poles | 97.2 /100 | #91 | Exceptional 15.7% |
| Scandinavians | 97.1 /100 | #92 | Exceptional 15.7% |
| Ukrainians | 97.1 /100 | #93 | Exceptional 15.7% |
| Immigrants | South Eastern Asia | 97.1 /100 | #94 | Exceptional 15.7% |
| Immigrants | Switzerland | 96.4 /100 | #95 | Exceptional 15.8% |
| Immigrants | Kazakhstan | 96.2 /100 | #96 | Exceptional 15.8% |
Demographics Similar to Immigrants from Sudan by Child Poverty Under the Age of 5
In terms of child poverty under the age of 5, the demographic groups most similar to Immigrants from Sudan are Ghanaian (19.2%, a difference of 0.080%), Ecuadorian (19.2%, a difference of 0.12%), Bermudan (19.2%, a difference of 0.17%), Cape Verdean (19.1%, a difference of 0.30%), and Immigrants from Eritrea (19.1%, a difference of 0.49%).
| Demographics | Rating | Rank | Child Poverty Under the Age of 5 |
| Immigrants | Nigeria | 2.1 /100 | #221 | Tragic 19.0% |
| Alsatians | 1.7 /100 | #222 | Tragic 19.1% |
| Cubans | 1.7 /100 | #223 | Tragic 19.1% |
| Nicaraguans | 1.6 /100 | #224 | Tragic 19.1% |
| Nigerians | 1.6 /100 | #225 | Tragic 19.1% |
| Immigrants | Eritrea | 1.5 /100 | #226 | Tragic 19.1% |
| Cape Verdeans | 1.4 /100 | #227 | Tragic 19.1% |
| Immigrants | Sudan | 1.3 /100 | #228 | Tragic 19.2% |
| Ghanaians | 1.2 /100 | #229 | Tragic 19.2% |
| Ecuadorians | 1.2 /100 | #230 | Tragic 19.2% |
| Bermudans | 1.2 /100 | #231 | Tragic 19.2% |
| Trinidadians and Tobagonians | 0.9 /100 | #232 | Tragic 19.3% |
| Sudanese | 0.9 /100 | #233 | Tragic 19.3% |
| Immigrants | Micronesia | 0.9 /100 | #234 | Tragic 19.4% |
| Immigrants | Laos | 0.8 /100 | #235 | Tragic 19.4% |