Immigrants from Norway vs Immigrants from Sudan Unemployment Among Ages 55 to 59 years
COMPARE
Immigrants from Norway
Immigrants from Sudan
Unemployment Among Ages 55 to 59 years
Unemployment Among Ages 55 to 59 years Comparison
Immigrants from Norway
Immigrants from Sudan
4.8%
UNEMPLOYMENT AMONG AGES 55 TO 59 YEARS
79.8/ 100
METRIC RATING
142nd/ 347
METRIC RANK
4.8%
UNEMPLOYMENT AMONG AGES 55 TO 59 YEARS
58.4/ 100
METRIC RATING
169th/ 347
METRIC RANK
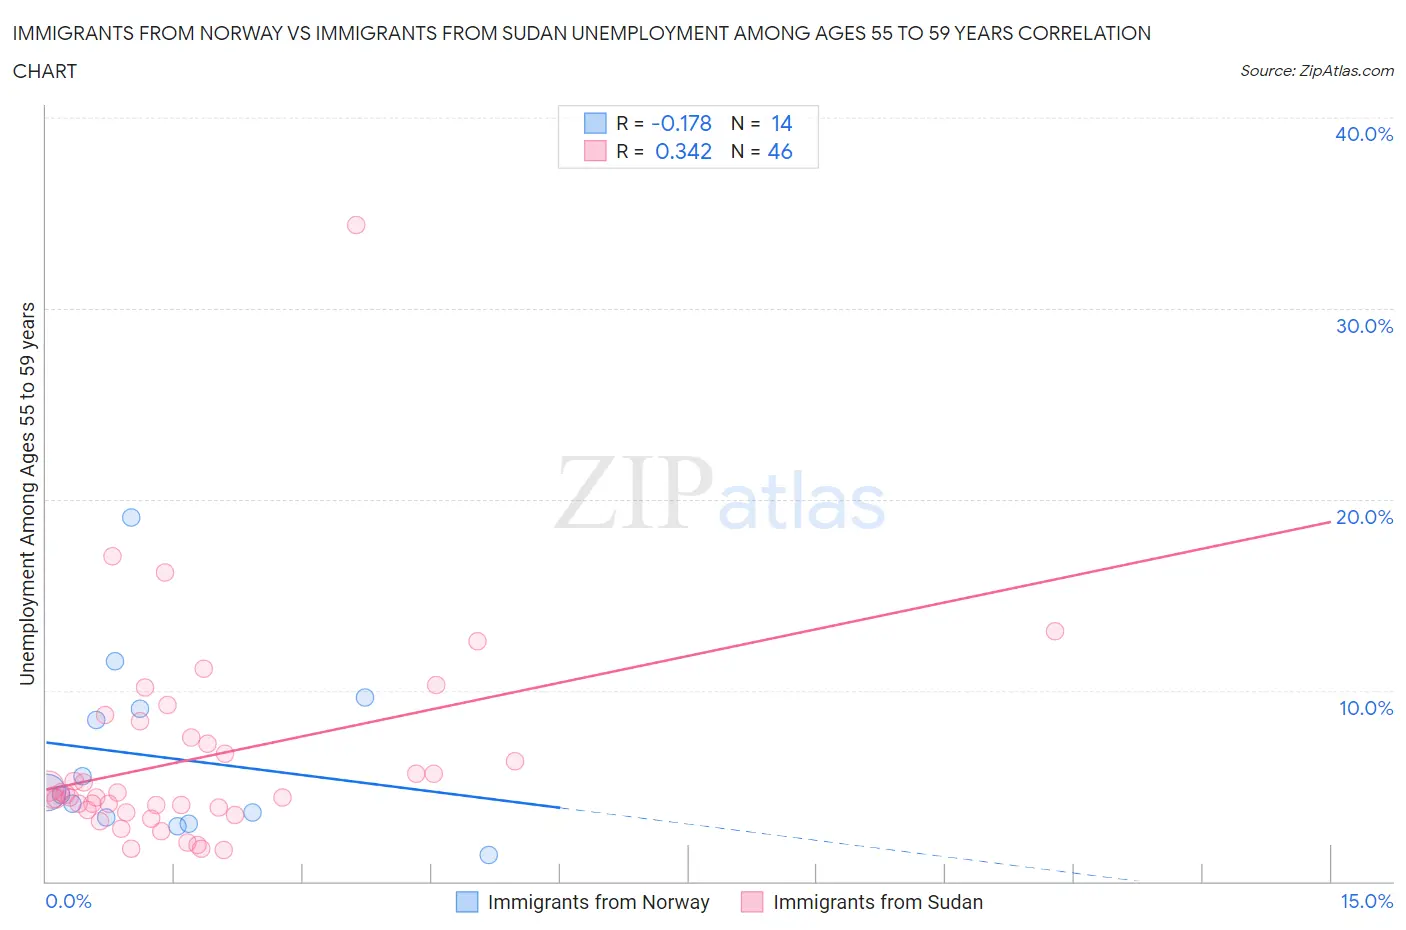
Immigrants from Norway vs Immigrants from Sudan Unemployment Among Ages 55 to 59 years Correlation Chart
The statistical analysis conducted on geographies consisting of 114,004,203 people shows a poor negative correlation between the proportion of Immigrants from Norway and unemployment rate among population between the ages 55 and 59 in the United States with a correlation coefficient (R) of -0.178 and weighted average of 4.8%. Similarly, the statistical analysis conducted on geographies consisting of 116,851,236 people shows a mild positive correlation between the proportion of Immigrants from Sudan and unemployment rate among population between the ages 55 and 59 in the United States with a correlation coefficient (R) of 0.342 and weighted average of 4.8%, a difference of 1.1%.
Unemployment Among Ages 55 to 59 years Correlation Summary
| Measurement | Immigrants from Norway | Immigrants from Sudan |
| Minimum | 1.4% | 1.6% |
| Maximum | 19.0% | 34.4% |
| Range | 17.6% | 32.8% |
| Mean | 6.5% | 6.5% |
| Median | 4.6% | 4.5% |
| Interquartile 25% (IQ1) | 3.3% | 3.7% |
| Interquartile 75% (IQ3) | 9.0% | 7.5% |
| Interquartile Range (IQR) | 5.7% | 3.8% |
| Standard Deviation (Sample) | 4.7% | 5.6% |
| Standard Deviation (Population) | 4.5% | 5.5% |
Similar Demographics by Unemployment Among Ages 55 to 59 years
Demographics Similar to Immigrants from Norway by Unemployment Among Ages 55 to 59 years
In terms of unemployment among ages 55 to 59 years, the demographic groups most similar to Immigrants from Norway are French Canadian (4.8%, a difference of 0.020%), Immigrants from Indonesia (4.8%, a difference of 0.030%), Ukrainian (4.8%, a difference of 0.070%), Immigrants from Asia (4.8%, a difference of 0.12%), and Immigrants from Northern Europe (4.8%, a difference of 0.14%).
| Demographics | Rating | Rank | Unemployment Among Ages 55 to 59 years |
| Slavs | 83.7 /100 | #135 | Excellent 4.7% |
| Colombians | 83.6 /100 | #136 | Excellent 4.7% |
| Delaware | 83.6 /100 | #137 | Excellent 4.7% |
| Immigrants | Switzerland | 82.9 /100 | #138 | Excellent 4.7% |
| Romanians | 82.7 /100 | #139 | Excellent 4.7% |
| Immigrants | Indonesia | 80.2 /100 | #140 | Excellent 4.8% |
| French Canadians | 80.1 /100 | #141 | Excellent 4.8% |
| Immigrants | Norway | 79.8 /100 | #142 | Good 4.8% |
| Ukrainians | 78.6 /100 | #143 | Good 4.8% |
| Immigrants | Asia | 77.8 /100 | #144 | Good 4.8% |
| Immigrants | Northern Europe | 77.5 /100 | #145 | Good 4.8% |
| Immigrants | South Eastern Asia | 77.4 /100 | #146 | Good 4.8% |
| Immigrants | Singapore | 76.6 /100 | #147 | Good 4.8% |
| Immigrants | Bahamas | 71.8 /100 | #148 | Good 4.8% |
| Immigrants | Lithuania | 70.8 /100 | #149 | Good 4.8% |
Demographics Similar to Immigrants from Sudan by Unemployment Among Ages 55 to 59 years
In terms of unemployment among ages 55 to 59 years, the demographic groups most similar to Immigrants from Sudan are Immigrants from Cambodia (4.8%, a difference of 0.040%), Immigrants from Western Europe (4.8%, a difference of 0.080%), Uruguayan (4.8%, a difference of 0.12%), Immigrants from France (4.8%, a difference of 0.15%), and Potawatomi (4.8%, a difference of 0.15%).
| Demographics | Rating | Rank | Unemployment Among Ages 55 to 59 years |
| Immigrants | Africa | 64.2 /100 | #162 | Good 4.8% |
| Immigrants | Lebanon | 63.8 /100 | #163 | Good 4.8% |
| Americans | 63.3 /100 | #164 | Good 4.8% |
| Immigrants | France | 62.0 /100 | #165 | Good 4.8% |
| Potawatomi | 62.0 /100 | #166 | Good 4.8% |
| Immigrants | Western Europe | 60.4 /100 | #167 | Good 4.8% |
| Immigrants | Cambodia | 59.3 /100 | #168 | Average 4.8% |
| Immigrants | Sudan | 58.4 /100 | #169 | Average 4.8% |
| Uruguayans | 55.6 /100 | #170 | Average 4.8% |
| Japanese | 54.5 /100 | #171 | Average 4.8% |
| Nicaraguans | 54.0 /100 | #172 | Average 4.8% |
| Immigrants | Eastern Europe | 52.2 /100 | #173 | Average 4.8% |
| Immigrants | Croatia | 50.0 /100 | #174 | Average 4.8% |
| Australians | 48.6 /100 | #175 | Average 4.8% |
| Samoans | 47.1 /100 | #176 | Average 4.8% |