Immigrants from Northern Africa vs Tsimshian Child Poverty Under the Age of 5
COMPARE
Immigrants from Northern Africa
Tsimshian
Child Poverty Under the Age of 5
Child Poverty Under the Age of 5 Comparison
Immigrants from Northern Africa
Tsimshian
16.4%
CHILD POVERTY UNDER THE AGE OF 5
87.5/ 100
METRIC RATING
136th/ 347
METRIC RANK
14.7%
CHILD POVERTY UNDER THE AGE OF 5
99.6/ 100
METRIC RATING
46th/ 347
METRIC RANK
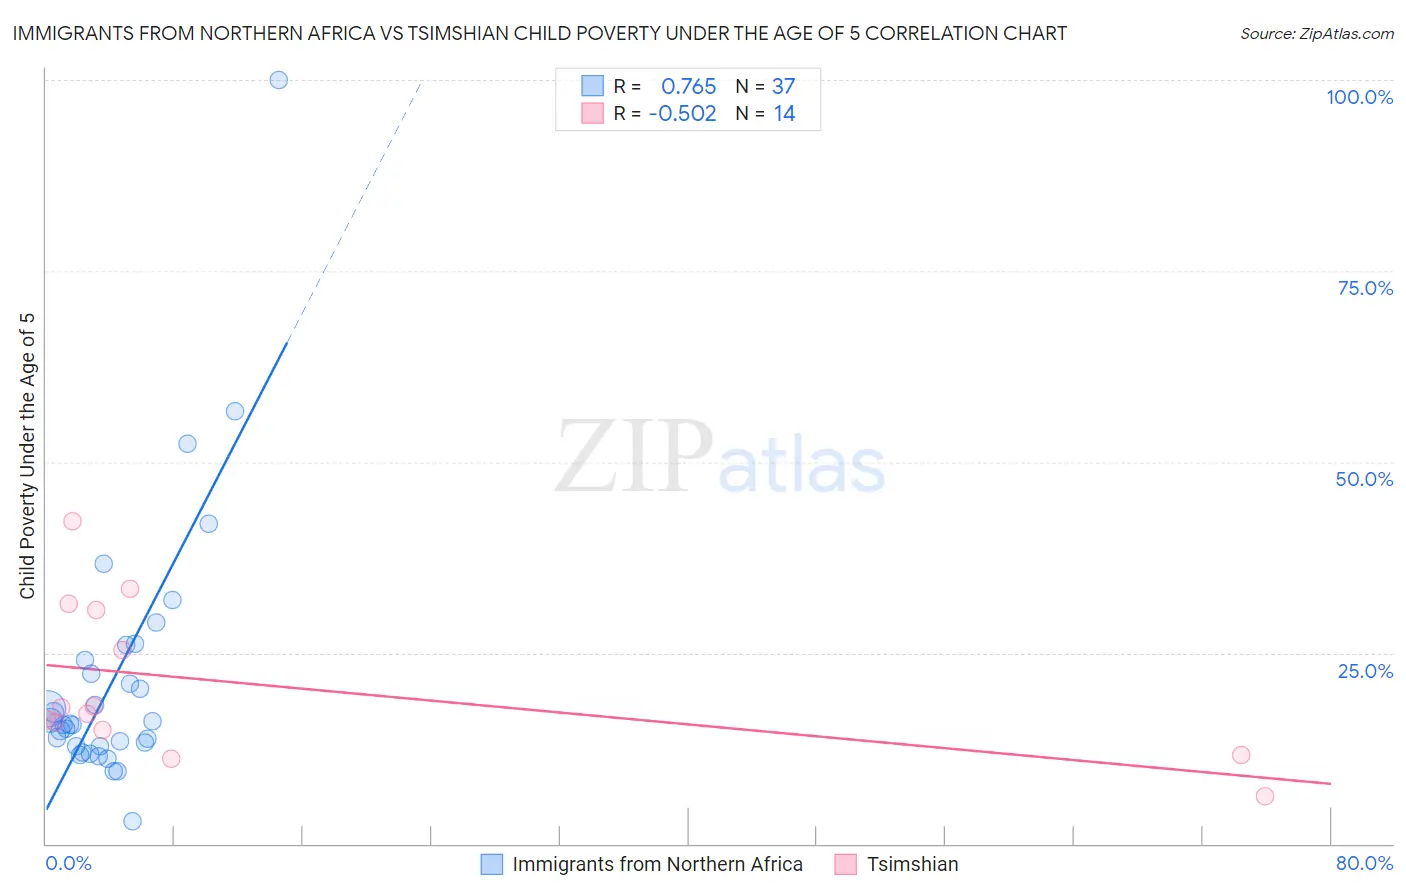
Immigrants from Northern Africa vs Tsimshian Child Poverty Under the Age of 5 Correlation Chart
The statistical analysis conducted on geographies consisting of 310,197,914 people shows a strong positive correlation between the proportion of Immigrants from Northern Africa and poverty level among children under the age of 5 in the United States with a correlation coefficient (R) of 0.765 and weighted average of 16.4%. Similarly, the statistical analysis conducted on geographies consisting of 15,568,381 people shows a substantial negative correlation between the proportion of Tsimshian and poverty level among children under the age of 5 in the United States with a correlation coefficient (R) of -0.502 and weighted average of 14.7%, a difference of 11.1%.
Child Poverty Under the Age of 5 Correlation Summary
| Measurement | Immigrants from Northern Africa | Tsimshian |
| Minimum | 2.9% | 6.2% |
| Maximum | 100.0% | 42.3% |
| Range | 97.1% | 36.2% |
| Mean | 21.9% | 20.8% |
| Median | 15.6% | 17.4% |
| Interquartile 25% (IQ1) | 12.8% | 14.9% |
| Interquartile 75% (IQ3) | 25.0% | 30.6% |
| Interquartile Range (IQR) | 12.2% | 15.6% |
| Standard Deviation (Sample) | 17.5% | 10.2% |
| Standard Deviation (Population) | 17.3% | 9.8% |
Similar Demographics by Child Poverty Under the Age of 5
Demographics Similar to Immigrants from Northern Africa by Child Poverty Under the Age of 5
In terms of child poverty under the age of 5, the demographic groups most similar to Immigrants from Northern Africa are Brazilian (16.4%, a difference of 0.060%), Immigrants from North Macedonia (16.4%, a difference of 0.070%), Icelander (16.3%, a difference of 0.090%), Serbian (16.3%, a difference of 0.16%), and Finnish (16.3%, a difference of 0.19%).
| Demographics | Rating | Rank | Child Poverty Under the Age of 5 |
| British | 89.4 /100 | #129 | Excellent 16.3% |
| Immigrants | Norway | 89.3 /100 | #130 | Excellent 16.3% |
| Finns | 88.3 /100 | #131 | Excellent 16.3% |
| Serbians | 88.2 /100 | #132 | Excellent 16.3% |
| Icelanders | 87.9 /100 | #133 | Excellent 16.3% |
| Immigrants | North Macedonia | 87.8 /100 | #134 | Excellent 16.4% |
| Brazilians | 87.8 /100 | #135 | Excellent 16.4% |
| Immigrants | Northern Africa | 87.5 /100 | #136 | Excellent 16.4% |
| Immigrants | Chile | 85.3 /100 | #137 | Excellent 16.4% |
| Germans | 84.8 /100 | #138 | Excellent 16.5% |
| Immigrants | Hungary | 84.5 /100 | #139 | Excellent 16.5% |
| Guamanians/Chamorros | 84.2 /100 | #140 | Excellent 16.5% |
| Immigrants | Western Europe | 83.3 /100 | #141 | Excellent 16.5% |
| Portuguese | 83.0 /100 | #142 | Excellent 16.5% |
| Samoans | 83.0 /100 | #143 | Excellent 16.5% |
Demographics Similar to Tsimshian by Child Poverty Under the Age of 5
In terms of child poverty under the age of 5, the demographic groups most similar to Tsimshian are Laotian (14.7%, a difference of 0.080%), Russian (14.8%, a difference of 0.14%), Immigrants from Philippines (14.7%, a difference of 0.20%), Immigrants from Czechoslovakia (14.8%, a difference of 0.24%), and Soviet Union (14.7%, a difference of 0.34%).
| Demographics | Rating | Rank | Child Poverty Under the Age of 5 |
| Norwegians | 99.7 /100 | #39 | Exceptional 14.6% |
| Immigrants | Australia | 99.7 /100 | #40 | Exceptional 14.6% |
| Immigrants | Belarus | 99.7 /100 | #41 | Exceptional 14.7% |
| Soviet Union | 99.7 /100 | #42 | Exceptional 14.7% |
| Immigrants | Greece | 99.7 /100 | #43 | Exceptional 14.7% |
| Immigrants | Philippines | 99.7 /100 | #44 | Exceptional 14.7% |
| Laotians | 99.6 /100 | #45 | Exceptional 14.7% |
| Tsimshian | 99.6 /100 | #46 | Exceptional 14.7% |
| Russians | 99.6 /100 | #47 | Exceptional 14.8% |
| Immigrants | Czechoslovakia | 99.6 /100 | #48 | Exceptional 14.8% |
| Immigrants | Bulgaria | 99.6 /100 | #49 | Exceptional 14.8% |
| Immigrants | Northern Europe | 99.6 /100 | #50 | Exceptional 14.8% |
| Estonians | 99.6 /100 | #51 | Exceptional 14.8% |
| Immigrants | Serbia | 99.5 /100 | #52 | Exceptional 14.9% |
| Luxembourgers | 99.4 /100 | #53 | Exceptional 14.9% |