Immigrants from North Macedonia vs Immigrants from Germany Male Poverty
COMPARE
Immigrants from North Macedonia
Immigrants from Germany
Male Poverty
Male Poverty Comparison
Immigrants from North Macedonia
Immigrants from Germany
9.4%
MALE POVERTY
99.8/ 100
METRIC RATING
14th/ 347
METRIC RANK
10.9%
MALE POVERTY
71.6/ 100
METRIC RATING
145th/ 347
METRIC RANK
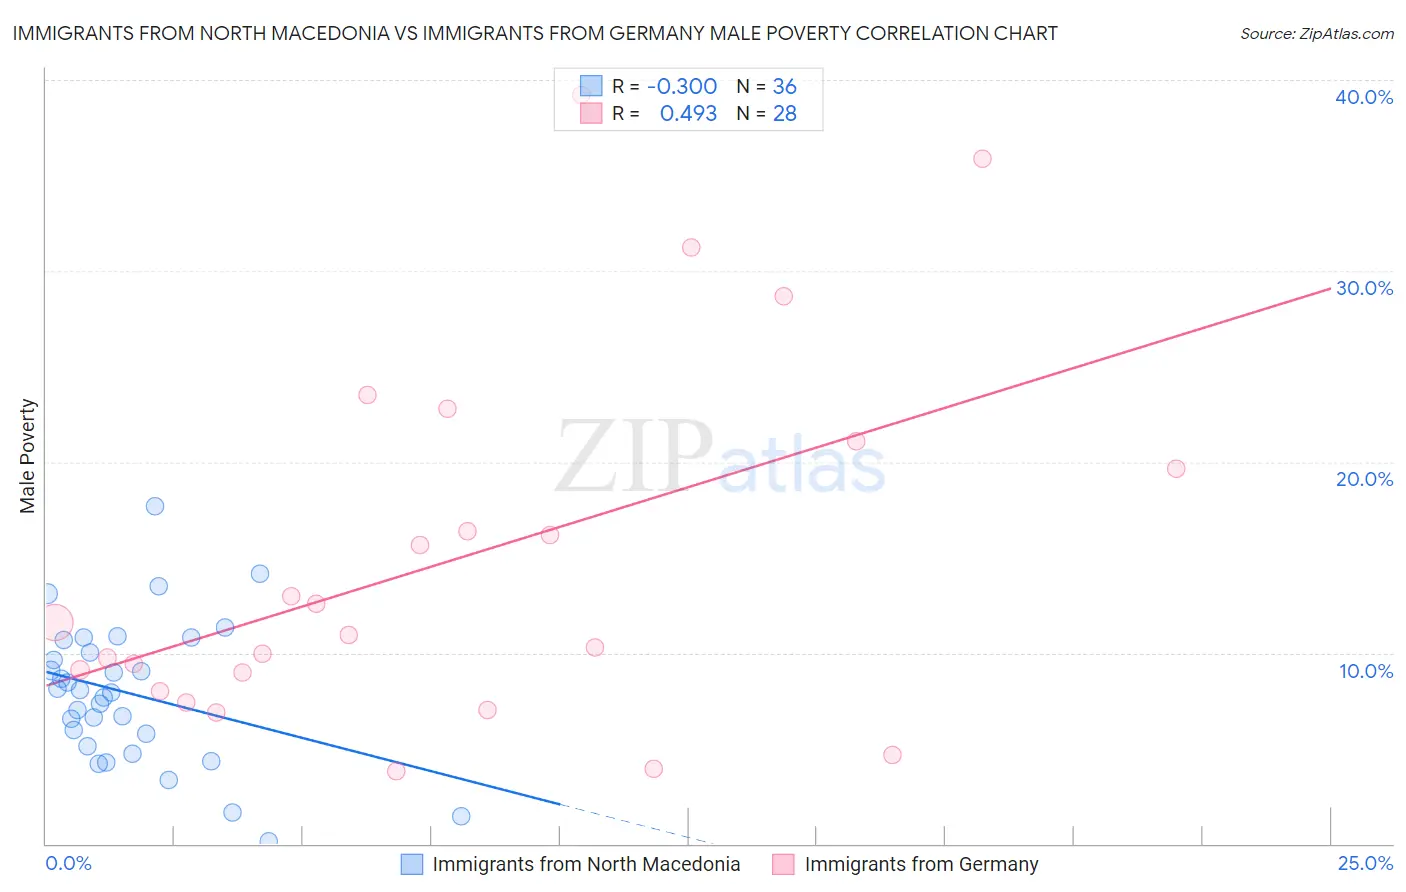
Immigrants from North Macedonia vs Immigrants from Germany Male Poverty Correlation Chart
The statistical analysis conducted on geographies consisting of 74,289,354 people shows a weak negative correlation between the proportion of Immigrants from North Macedonia and poverty level among males in the United States with a correlation coefficient (R) of -0.300 and weighted average of 9.4%. Similarly, the statistical analysis conducted on geographies consisting of 463,516,285 people shows a moderate positive correlation between the proportion of Immigrants from Germany and poverty level among males in the United States with a correlation coefficient (R) of 0.493 and weighted average of 10.9%, a difference of 15.9%.
Male Poverty Correlation Summary
| Measurement | Immigrants from North Macedonia | Immigrants from Germany |
| Minimum | 0.15% | 3.8% |
| Maximum | 17.7% | 39.2% |
| Range | 17.6% | 35.4% |
| Mean | 7.9% | 14.9% |
| Median | 8.0% | 11.2% |
| Interquartile 25% (IQ1) | 5.4% | 8.5% |
| Interquartile 75% (IQ3) | 10.3% | 20.4% |
| Interquartile Range (IQR) | 4.9% | 11.9% |
| Standard Deviation (Sample) | 3.7% | 9.6% |
| Standard Deviation (Population) | 3.7% | 9.4% |
Similar Demographics by Male Poverty
Demographics Similar to Immigrants from North Macedonia by Male Poverty
In terms of male poverty, the demographic groups most similar to Immigrants from North Macedonia are Bhutanese (9.5%, a difference of 0.29%), Immigrants from Lithuania (9.4%, a difference of 0.38%), Immigrants from Bolivia (9.4%, a difference of 0.50%), Bolivian (9.4%, a difference of 0.56%), and Luxembourger (9.5%, a difference of 0.81%).
| Demographics | Rating | Rank | Male Poverty |
| Immigrants | Ireland | 99.9 /100 | #7 | Exceptional 9.1% |
| Filipinos | 99.9 /100 | #8 | Exceptional 9.2% |
| Immigrants | South Central Asia | 99.9 /100 | #9 | Exceptional 9.3% |
| Bulgarians | 99.9 /100 | #10 | Exceptional 9.3% |
| Bolivians | 99.9 /100 | #11 | Exceptional 9.4% |
| Immigrants | Bolivia | 99.9 /100 | #12 | Exceptional 9.4% |
| Immigrants | Lithuania | 99.9 /100 | #13 | Exceptional 9.4% |
| Immigrants | North Macedonia | 99.8 /100 | #14 | Exceptional 9.4% |
| Bhutanese | 99.8 /100 | #15 | Exceptional 9.5% |
| Luxembourgers | 99.8 /100 | #16 | Exceptional 9.5% |
| Norwegians | 99.8 /100 | #17 | Exceptional 9.5% |
| Lithuanians | 99.8 /100 | #18 | Exceptional 9.5% |
| Immigrants | Hong Kong | 99.7 /100 | #19 | Exceptional 9.6% |
| Latvians | 99.7 /100 | #20 | Exceptional 9.6% |
| Immigrants | Scotland | 99.7 /100 | #21 | Exceptional 9.6% |
Demographics Similar to Immigrants from Germany by Male Poverty
In terms of male poverty, the demographic groups most similar to Immigrants from Germany are Samoan (10.9%, a difference of 0.020%), Syrian (10.9%, a difference of 0.030%), Afghan (10.9%, a difference of 0.040%), Icelander (11.0%, a difference of 0.37%), and Basque (10.9%, a difference of 0.38%).
| Demographics | Rating | Rank | Male Poverty |
| Yugoslavians | 78.2 /100 | #138 | Good 10.8% |
| Immigrants | Jordan | 77.5 /100 | #139 | Good 10.8% |
| Tlingit-Haida | 76.1 /100 | #140 | Good 10.9% |
| Immigrants | France | 75.8 /100 | #141 | Good 10.9% |
| Basques | 74.6 /100 | #142 | Good 10.9% |
| Afghans | 71.9 /100 | #143 | Good 10.9% |
| Samoans | 71.8 /100 | #144 | Good 10.9% |
| Immigrants | Germany | 71.6 /100 | #145 | Good 10.9% |
| Syrians | 71.4 /100 | #146 | Good 10.9% |
| Icelanders | 68.5 /100 | #147 | Good 11.0% |
| Armenians | 68.0 /100 | #148 | Good 11.0% |
| Immigrants | Venezuela | 67.9 /100 | #149 | Good 11.0% |
| Guamanians/Chamorros | 67.6 /100 | #150 | Good 11.0% |
| Venezuelans | 67.4 /100 | #151 | Good 11.0% |
| Immigrants | Nepal | 67.3 /100 | #152 | Good 11.0% |