Immigrants from North Macedonia vs Immigrants from Northern Europe Male Poverty
COMPARE
Immigrants from North Macedonia
Immigrants from Northern Europe
Male Poverty
Male Poverty Comparison
Immigrants from North Macedonia
Immigrants from Northern Europe
9.4%
MALE POVERTY
99.8/ 100
METRIC RATING
14th/ 347
METRIC RANK
9.7%
MALE POVERTY
99.5/ 100
METRIC RATING
33rd/ 347
METRIC RANK
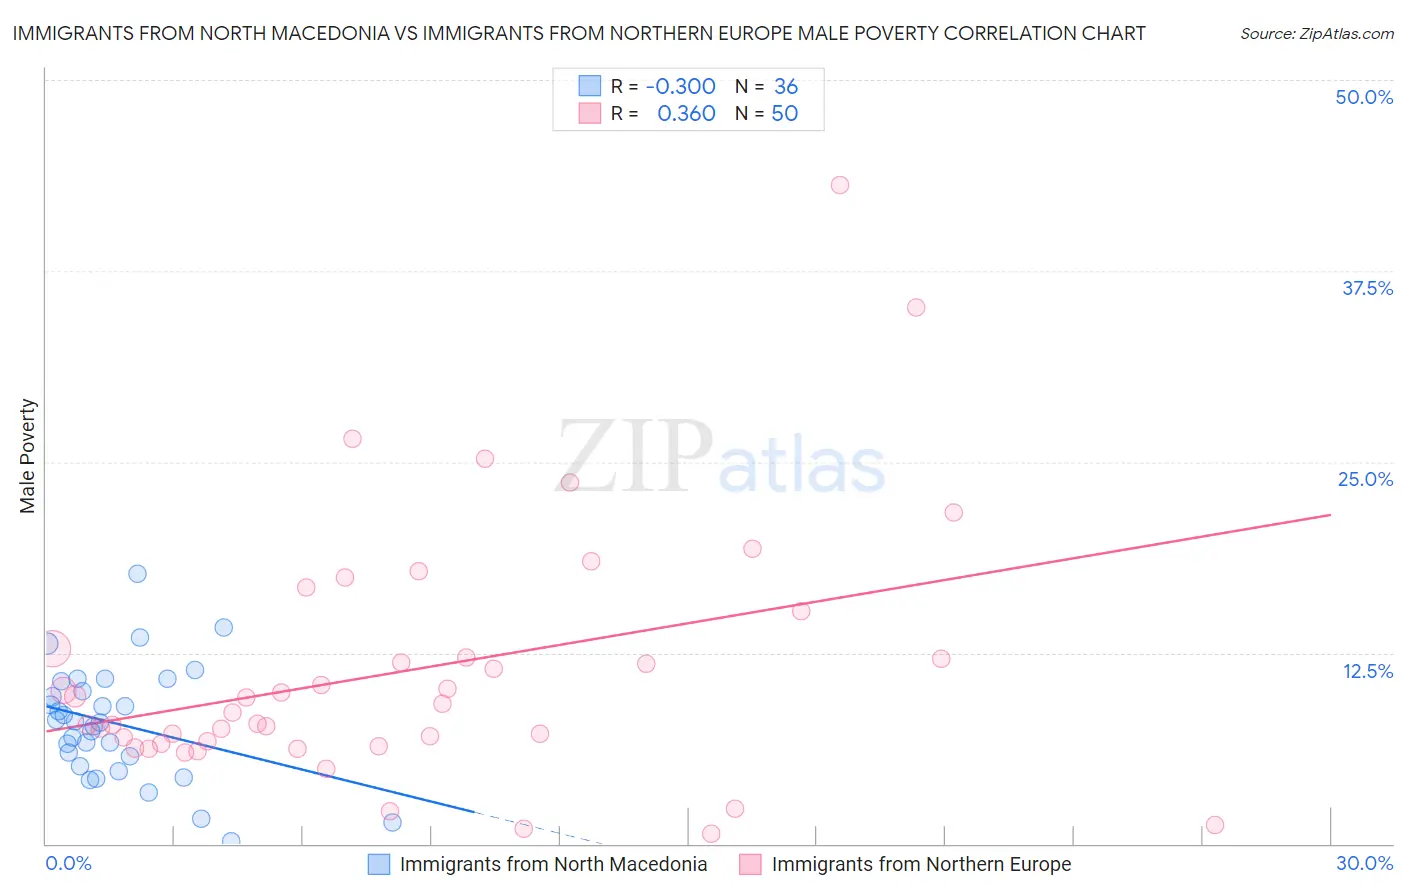
Immigrants from North Macedonia vs Immigrants from Northern Europe Male Poverty Correlation Chart
The statistical analysis conducted on geographies consisting of 74,289,354 people shows a weak negative correlation between the proportion of Immigrants from North Macedonia and poverty level among males in the United States with a correlation coefficient (R) of -0.300 and weighted average of 9.4%. Similarly, the statistical analysis conducted on geographies consisting of 476,600,632 people shows a mild positive correlation between the proportion of Immigrants from Northern Europe and poverty level among males in the United States with a correlation coefficient (R) of 0.360 and weighted average of 9.7%, a difference of 3.3%.
Male Poverty Correlation Summary
| Measurement | Immigrants from North Macedonia | Immigrants from Northern Europe |
| Minimum | 0.15% | 0.64% |
| Maximum | 17.7% | 43.1% |
| Range | 17.6% | 42.5% |
| Mean | 7.9% | 11.3% |
| Median | 8.0% | 8.9% |
| Interquartile 25% (IQ1) | 5.4% | 6.5% |
| Interquartile 75% (IQ3) | 10.3% | 12.7% |
| Interquartile Range (IQR) | 4.9% | 6.2% |
| Standard Deviation (Sample) | 3.7% | 8.3% |
| Standard Deviation (Population) | 3.7% | 8.3% |
Demographics Similar to Immigrants from North Macedonia and Immigrants from Northern Europe by Male Poverty
In terms of male poverty, the demographic groups most similar to Immigrants from North Macedonia are Bhutanese (9.5%, a difference of 0.29%), Immigrants from Lithuania (9.4%, a difference of 0.38%), Luxembourger (9.5%, a difference of 0.81%), Norwegian (9.5%, a difference of 0.94%), and Lithuanian (9.5%, a difference of 1.1%). Similarly, the demographic groups most similar to Immigrants from Northern Europe are Macedonian (9.7%, a difference of 0.090%), Tongan (9.7%, a difference of 0.29%), Polish (9.7%, a difference of 0.31%), Greek (9.7%, a difference of 0.39%), and Immigrants from Korea (9.7%, a difference of 0.43%).
| Demographics | Rating | Rank | Male Poverty |
| Immigrants | Lithuania | 99.9 /100 | #13 | Exceptional 9.4% |
| Immigrants | North Macedonia | 99.8 /100 | #14 | Exceptional 9.4% |
| Bhutanese | 99.8 /100 | #15 | Exceptional 9.5% |
| Luxembourgers | 99.8 /100 | #16 | Exceptional 9.5% |
| Norwegians | 99.8 /100 | #17 | Exceptional 9.5% |
| Lithuanians | 99.8 /100 | #18 | Exceptional 9.5% |
| Immigrants | Hong Kong | 99.7 /100 | #19 | Exceptional 9.6% |
| Latvians | 99.7 /100 | #20 | Exceptional 9.6% |
| Immigrants | Scotland | 99.7 /100 | #21 | Exceptional 9.6% |
| Croatians | 99.7 /100 | #22 | Exceptional 9.6% |
| Italians | 99.7 /100 | #23 | Exceptional 9.6% |
| Swedes | 99.7 /100 | #24 | Exceptional 9.6% |
| Eastern Europeans | 99.6 /100 | #25 | Exceptional 9.6% |
| Burmese | 99.6 /100 | #26 | Exceptional 9.7% |
| Danes | 99.6 /100 | #27 | Exceptional 9.7% |
| Immigrants | Korea | 99.6 /100 | #28 | Exceptional 9.7% |
| Greeks | 99.6 /100 | #29 | Exceptional 9.7% |
| Poles | 99.5 /100 | #30 | Exceptional 9.7% |
| Tongans | 99.5 /100 | #31 | Exceptional 9.7% |
| Macedonians | 99.5 /100 | #32 | Exceptional 9.7% |
| Immigrants | Northern Europe | 99.5 /100 | #33 | Exceptional 9.7% |