Ugandan vs Immigrants from Germany Male Poverty
COMPARE
Ugandan
Immigrants from Germany
Male Poverty
Male Poverty Comparison
Ugandans
Immigrants from Germany
12.2%
MALE POVERTY
2.2/ 100
METRIC RATING
221st/ 347
METRIC RANK
10.9%
MALE POVERTY
71.6/ 100
METRIC RATING
145th/ 347
METRIC RANK
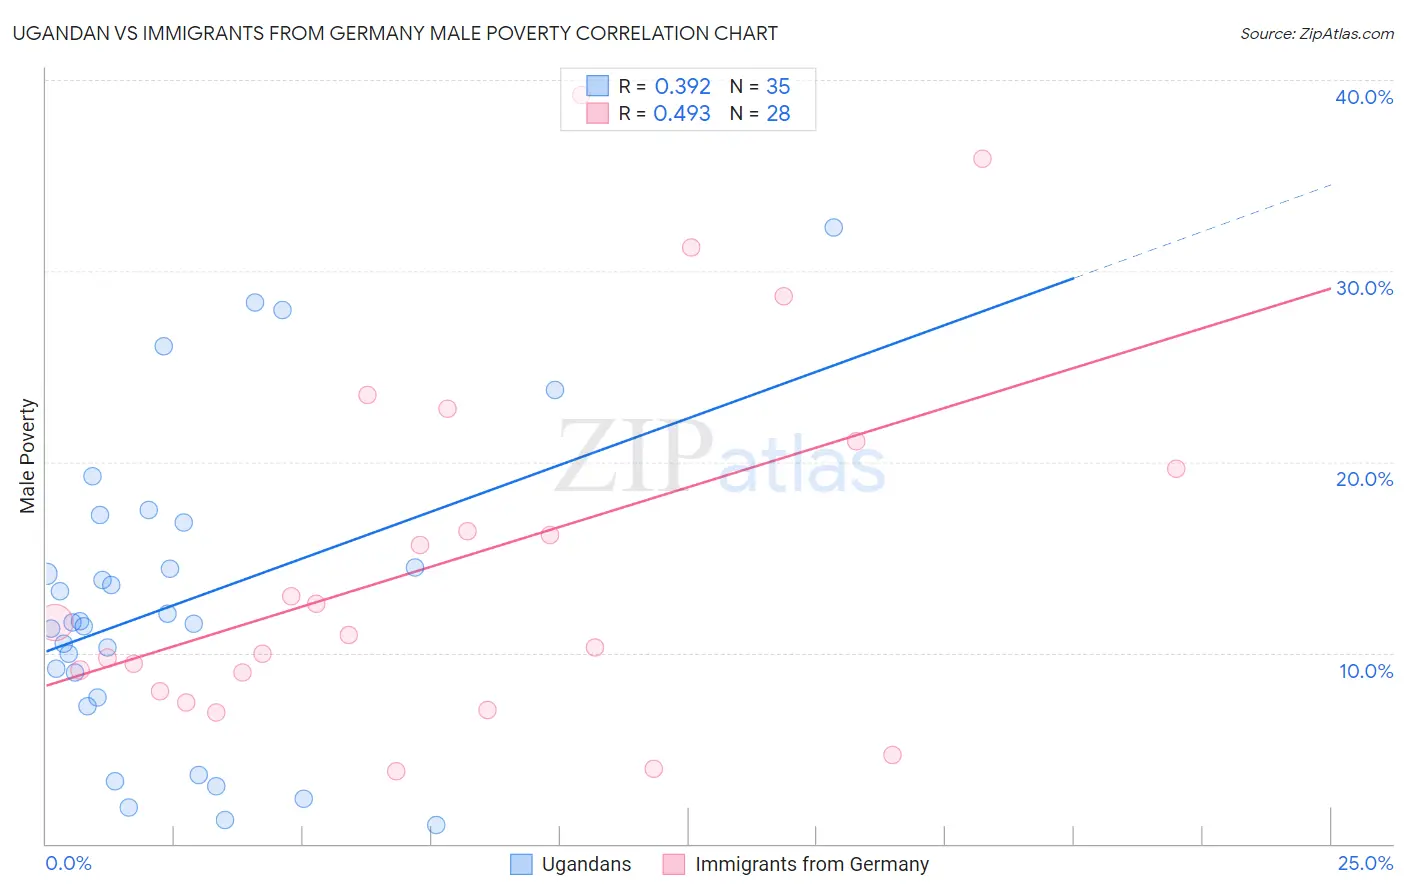
Ugandan vs Immigrants from Germany Male Poverty Correlation Chart
The statistical analysis conducted on geographies consisting of 93,987,101 people shows a mild positive correlation between the proportion of Ugandans and poverty level among males in the United States with a correlation coefficient (R) of 0.392 and weighted average of 12.2%. Similarly, the statistical analysis conducted on geographies consisting of 463,516,285 people shows a moderate positive correlation between the proportion of Immigrants from Germany and poverty level among males in the United States with a correlation coefficient (R) of 0.493 and weighted average of 10.9%, a difference of 11.9%.
Male Poverty Correlation Summary
| Measurement | Ugandan | Immigrants from Germany |
| Minimum | 0.96% | 3.8% |
| Maximum | 32.3% | 39.2% |
| Range | 31.3% | 35.4% |
| Mean | 12.6% | 14.9% |
| Median | 11.6% | 11.2% |
| Interquartile 25% (IQ1) | 7.6% | 8.5% |
| Interquartile 75% (IQ3) | 16.8% | 20.4% |
| Interquartile Range (IQR) | 9.2% | 11.9% |
| Standard Deviation (Sample) | 7.9% | 9.6% |
| Standard Deviation (Population) | 7.8% | 9.4% |
Similar Demographics by Male Poverty
Demographics Similar to Ugandans by Male Poverty
In terms of male poverty, the demographic groups most similar to Ugandans are Immigrants from Africa (12.2%, a difference of 0.020%), Immigrants from Micronesia (12.2%, a difference of 0.040%), Immigrants from Eritrea (12.2%, a difference of 0.21%), Bermudan (12.2%, a difference of 0.23%), and German Russian (12.2%, a difference of 0.29%).
| Demographics | Rating | Rank | Male Poverty |
| Japanese | 2.7 /100 | #214 | Tragic 12.2% |
| Immigrants | Uzbekistan | 2.6 /100 | #215 | Tragic 12.2% |
| Immigrants | Cambodia | 2.5 /100 | #216 | Tragic 12.2% |
| Immigrants | Thailand | 2.5 /100 | #217 | Tragic 12.2% |
| German Russians | 2.5 /100 | #218 | Tragic 12.2% |
| Bermudans | 2.4 /100 | #219 | Tragic 12.2% |
| Immigrants | Eritrea | 2.4 /100 | #220 | Tragic 12.2% |
| Ugandans | 2.2 /100 | #221 | Tragic 12.2% |
| Immigrants | Africa | 2.1 /100 | #222 | Tragic 12.2% |
| Immigrants | Micronesia | 2.1 /100 | #223 | Tragic 12.2% |
| Immigrants | Nigeria | 1.6 /100 | #224 | Tragic 12.3% |
| Osage | 1.5 /100 | #225 | Tragic 12.3% |
| Nigerians | 1.4 /100 | #226 | Tragic 12.3% |
| Alaska Natives | 1.4 /100 | #227 | Tragic 12.4% |
| Alsatians | 1.3 /100 | #228 | Tragic 12.4% |
Demographics Similar to Immigrants from Germany by Male Poverty
In terms of male poverty, the demographic groups most similar to Immigrants from Germany are Samoan (10.9%, a difference of 0.020%), Syrian (10.9%, a difference of 0.030%), Afghan (10.9%, a difference of 0.040%), Icelander (11.0%, a difference of 0.37%), and Basque (10.9%, a difference of 0.38%).
| Demographics | Rating | Rank | Male Poverty |
| Yugoslavians | 78.2 /100 | #138 | Good 10.8% |
| Immigrants | Jordan | 77.5 /100 | #139 | Good 10.8% |
| Tlingit-Haida | 76.1 /100 | #140 | Good 10.9% |
| Immigrants | France | 75.8 /100 | #141 | Good 10.9% |
| Basques | 74.6 /100 | #142 | Good 10.9% |
| Afghans | 71.9 /100 | #143 | Good 10.9% |
| Samoans | 71.8 /100 | #144 | Good 10.9% |
| Immigrants | Germany | 71.6 /100 | #145 | Good 10.9% |
| Syrians | 71.4 /100 | #146 | Good 10.9% |
| Icelanders | 68.5 /100 | #147 | Good 11.0% |
| Armenians | 68.0 /100 | #148 | Good 11.0% |
| Immigrants | Venezuela | 67.9 /100 | #149 | Good 11.0% |
| Guamanians/Chamorros | 67.6 /100 | #150 | Good 11.0% |
| Venezuelans | 67.4 /100 | #151 | Good 11.0% |
| Immigrants | Nepal | 67.3 /100 | #152 | Good 11.0% |