Asian vs Immigrants from Germany Male Poverty
COMPARE
Asian
Immigrants from Germany
Male Poverty
Male Poverty Comparison
Asians
Immigrants from Germany
10.0%
MALE POVERTY
98.7/ 100
METRIC RATING
52nd/ 347
METRIC RANK
10.9%
MALE POVERTY
71.6/ 100
METRIC RATING
145th/ 347
METRIC RANK
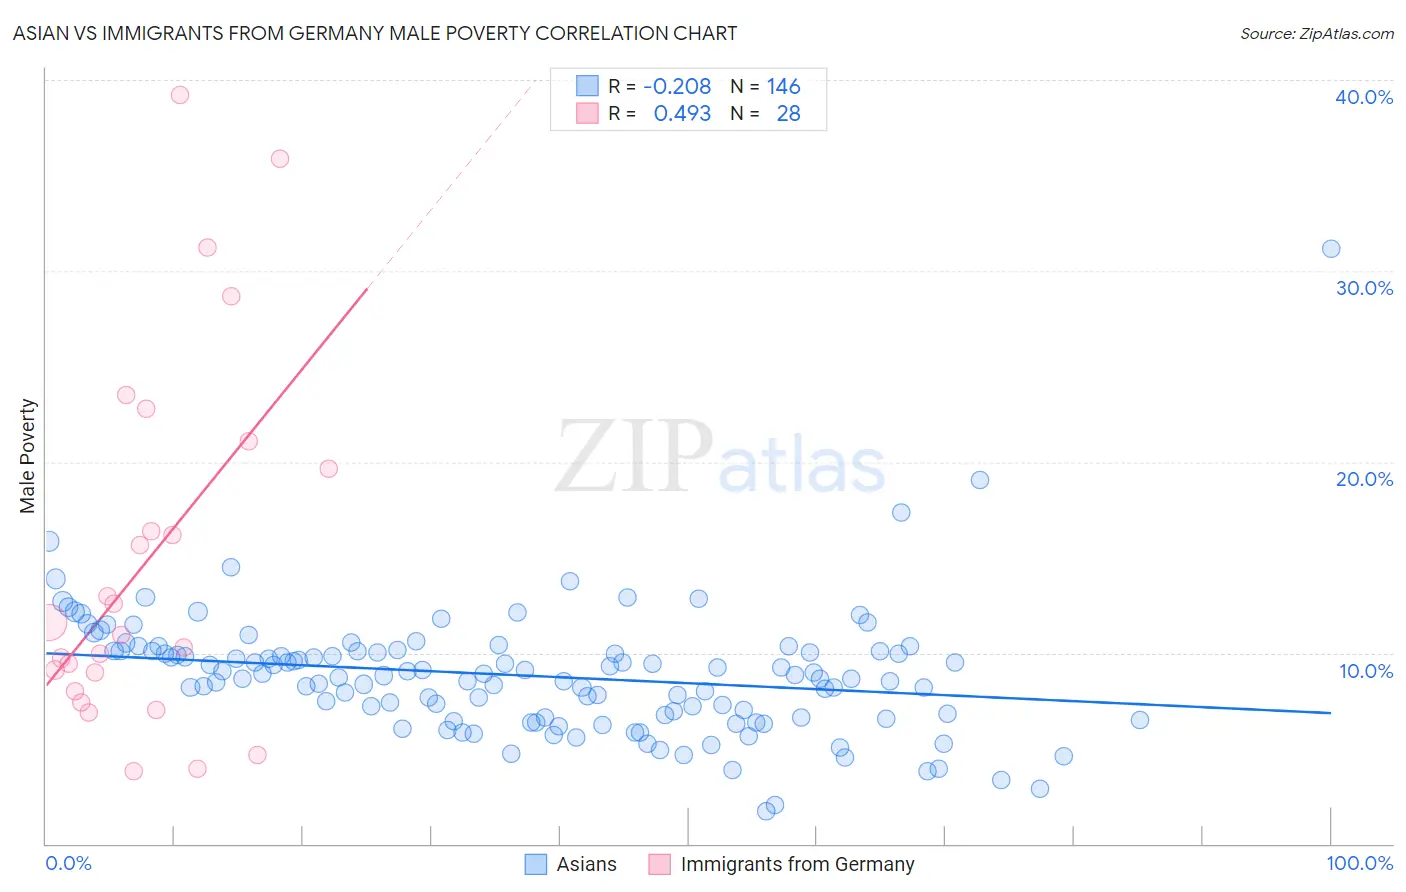
Asian vs Immigrants from Germany Male Poverty Correlation Chart
The statistical analysis conducted on geographies consisting of 549,643,011 people shows a weak negative correlation between the proportion of Asians and poverty level among males in the United States with a correlation coefficient (R) of -0.208 and weighted average of 10.0%. Similarly, the statistical analysis conducted on geographies consisting of 463,516,285 people shows a moderate positive correlation between the proportion of Immigrants from Germany and poverty level among males in the United States with a correlation coefficient (R) of 0.493 and weighted average of 10.9%, a difference of 9.2%.
Male Poverty Correlation Summary
| Measurement | Asian | Immigrants from Germany |
| Minimum | 1.7% | 3.8% |
| Maximum | 31.2% | 39.2% |
| Range | 29.4% | 35.4% |
| Mean | 8.8% | 14.9% |
| Median | 8.8% | 11.2% |
| Interquartile 25% (IQ1) | 6.6% | 8.5% |
| Interquartile 75% (IQ3) | 10.1% | 20.4% |
| Interquartile Range (IQR) | 3.5% | 11.9% |
| Standard Deviation (Sample) | 3.3% | 9.6% |
| Standard Deviation (Population) | 3.3% | 9.4% |
Similar Demographics by Male Poverty
Demographics Similar to Asians by Male Poverty
In terms of male poverty, the demographic groups most similar to Asians are Immigrants from Czechoslovakia (10.0%, a difference of 0.070%), Immigrants from Croatia (10.0%, a difference of 0.090%), Immigrants from Philippines (10.0%, a difference of 0.19%), Slovene (10.0%, a difference of 0.24%), and Immigrants from Singapore (10.0%, a difference of 0.34%).
| Demographics | Rating | Rank | Male Poverty |
| Immigrants | Serbia | 98.9 /100 | #45 | Exceptional 10.0% |
| Turks | 98.9 /100 | #46 | Exceptional 10.0% |
| Immigrants | Singapore | 98.8 /100 | #47 | Exceptional 10.0% |
| Immigrants | Japan | 98.8 /100 | #48 | Exceptional 10.0% |
| Slovenes | 98.8 /100 | #49 | Exceptional 10.0% |
| Immigrants | Philippines | 98.7 /100 | #50 | Exceptional 10.0% |
| Immigrants | Croatia | 98.7 /100 | #51 | Exceptional 10.0% |
| Asians | 98.7 /100 | #52 | Exceptional 10.0% |
| Immigrants | Czechoslovakia | 98.6 /100 | #53 | Exceptional 10.0% |
| Immigrants | Austria | 98.5 /100 | #54 | Exceptional 10.0% |
| Germans | 98.3 /100 | #55 | Exceptional 10.1% |
| Immigrants | Bulgaria | 98.2 /100 | #56 | Exceptional 10.1% |
| Estonians | 98.1 /100 | #57 | Exceptional 10.1% |
| Scandinavians | 98.0 /100 | #58 | Exceptional 10.1% |
| Immigrants | Europe | 97.9 /100 | #59 | Exceptional 10.1% |
Demographics Similar to Immigrants from Germany by Male Poverty
In terms of male poverty, the demographic groups most similar to Immigrants from Germany are Samoan (10.9%, a difference of 0.020%), Syrian (10.9%, a difference of 0.030%), Afghan (10.9%, a difference of 0.040%), Icelander (11.0%, a difference of 0.37%), and Basque (10.9%, a difference of 0.38%).
| Demographics | Rating | Rank | Male Poverty |
| Yugoslavians | 78.2 /100 | #138 | Good 10.8% |
| Immigrants | Jordan | 77.5 /100 | #139 | Good 10.8% |
| Tlingit-Haida | 76.1 /100 | #140 | Good 10.9% |
| Immigrants | France | 75.8 /100 | #141 | Good 10.9% |
| Basques | 74.6 /100 | #142 | Good 10.9% |
| Afghans | 71.9 /100 | #143 | Good 10.9% |
| Samoans | 71.8 /100 | #144 | Good 10.9% |
| Immigrants | Germany | 71.6 /100 | #145 | Good 10.9% |
| Syrians | 71.4 /100 | #146 | Good 10.9% |
| Icelanders | 68.5 /100 | #147 | Good 11.0% |
| Armenians | 68.0 /100 | #148 | Good 11.0% |
| Immigrants | Venezuela | 67.9 /100 | #149 | Good 11.0% |
| Guamanians/Chamorros | 67.6 /100 | #150 | Good 11.0% |
| Venezuelans | 67.4 /100 | #151 | Good 11.0% |
| Immigrants | Nepal | 67.3 /100 | #152 | Good 11.0% |