Immigrants from North Macedonia vs Chippewa Female Unemployment
COMPARE
Immigrants from North Macedonia
Chippewa
Female Unemployment
Female Unemployment Comparison
Immigrants from North Macedonia
Chippewa
5.1%
FEMALE UNEMPLOYMENT
88.3/ 100
METRIC RATING
119th/ 347
METRIC RANK
6.1%
FEMALE UNEMPLOYMENT
0.0/ 100
METRIC RATING
286th/ 347
METRIC RANK
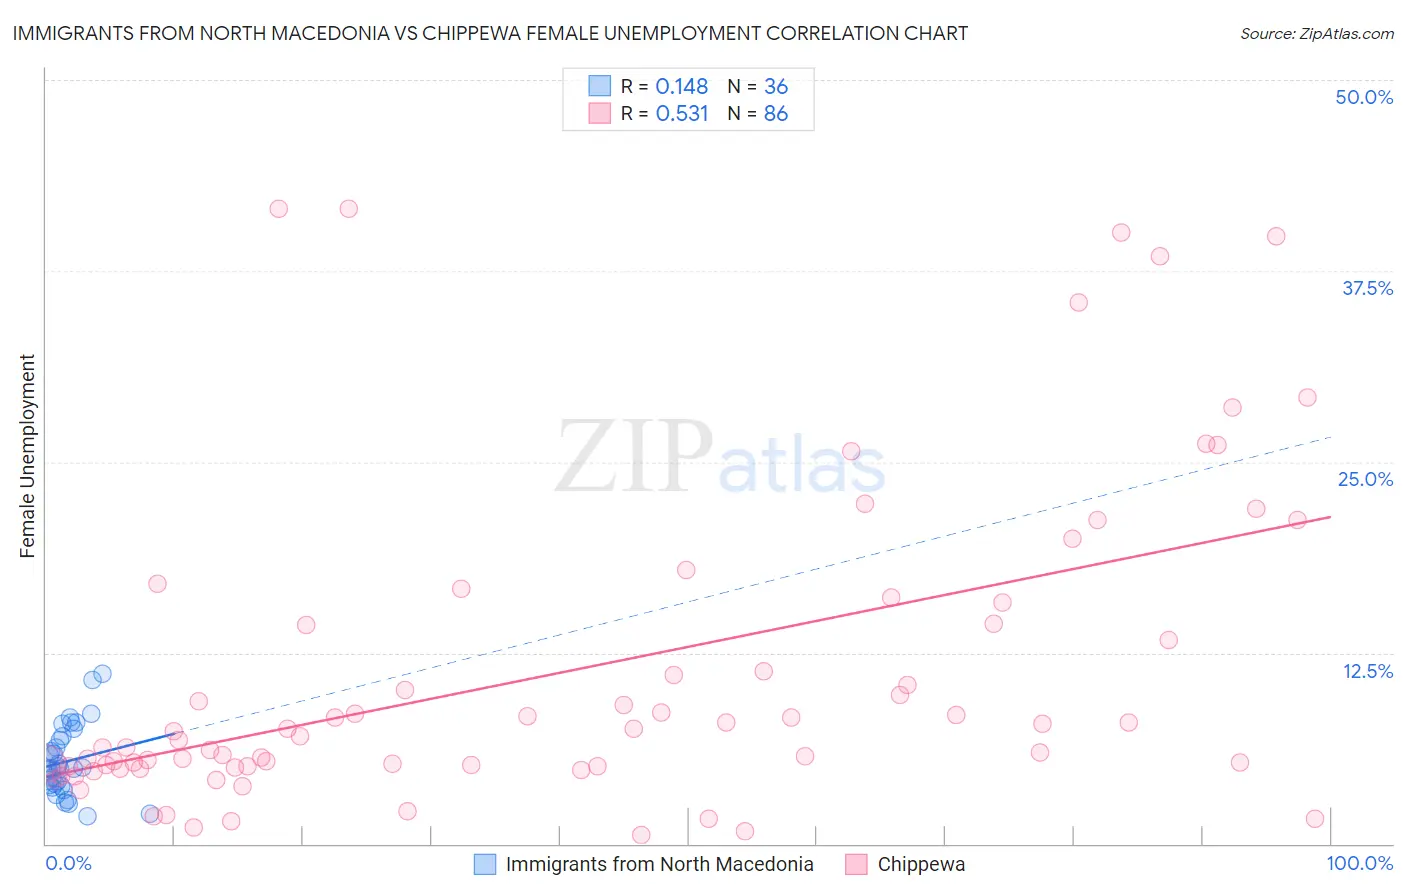
Immigrants from North Macedonia vs Chippewa Female Unemployment Correlation Chart
The statistical analysis conducted on geographies consisting of 74,255,623 people shows a poor positive correlation between the proportion of Immigrants from North Macedonia and unemploymnet rate among females in the United States with a correlation coefficient (R) of 0.148 and weighted average of 5.1%. Similarly, the statistical analysis conducted on geographies consisting of 213,753,903 people shows a substantial positive correlation between the proportion of Chippewa and unemploymnet rate among females in the United States with a correlation coefficient (R) of 0.531 and weighted average of 6.1%, a difference of 19.3%.
Female Unemployment Correlation Summary
| Measurement | Immigrants from North Macedonia | Chippewa |
| Minimum | 1.8% | 0.60% |
| Maximum | 11.1% | 41.6% |
| Range | 9.3% | 41.0% |
| Mean | 5.4% | 11.2% |
| Median | 4.9% | 7.2% |
| Interquartile 25% (IQ1) | 3.8% | 5.1% |
| Interquartile 75% (IQ3) | 6.9% | 14.4% |
| Interquartile Range (IQR) | 3.1% | 9.3% |
| Standard Deviation (Sample) | 2.3% | 10.3% |
| Standard Deviation (Population) | 2.2% | 10.2% |
Similar Demographics by Female Unemployment
Demographics Similar to Immigrants from North Macedonia by Female Unemployment
In terms of female unemployment, the demographic groups most similar to Immigrants from North Macedonia are Immigrants from Romania (5.1%, a difference of 0.020%), Immigrants from Western Europe (5.1%, a difference of 0.030%), Immigrants from Germany (5.1%, a difference of 0.10%), Immigrants from South Africa (5.1%, a difference of 0.10%), and Immigrants from Europe (5.1%, a difference of 0.15%).
| Demographics | Rating | Rank | Female Unemployment |
| Estonians | 92.1 /100 | #112 | Exceptional 5.1% |
| Immigrants | Saudi Arabia | 91.2 /100 | #113 | Exceptional 5.1% |
| Immigrants | Turkey | 91.0 /100 | #114 | Exceptional 5.1% |
| Lebanese | 91.0 /100 | #115 | Exceptional 5.1% |
| Americans | 90.5 /100 | #116 | Exceptional 5.1% |
| Jordanians | 90.3 /100 | #117 | Exceptional 5.1% |
| Immigrants | Croatia | 89.9 /100 | #118 | Excellent 5.1% |
| Immigrants | North Macedonia | 88.3 /100 | #119 | Excellent 5.1% |
| Immigrants | Romania | 88.1 /100 | #120 | Excellent 5.1% |
| Immigrants | Western Europe | 88.1 /100 | #121 | Excellent 5.1% |
| Immigrants | Germany | 87.6 /100 | #122 | Excellent 5.1% |
| Immigrants | South Africa | 87.6 /100 | #123 | Excellent 5.1% |
| Immigrants | Europe | 87.2 /100 | #124 | Excellent 5.1% |
| Basques | 86.5 /100 | #125 | Excellent 5.1% |
| Immigrants | Korea | 86.3 /100 | #126 | Excellent 5.1% |
Demographics Similar to Chippewa by Female Unemployment
In terms of female unemployment, the demographic groups most similar to Chippewa are Immigrants from Cabo Verde (6.1%, a difference of 0.030%), Immigrants from Guatemala (6.1%, a difference of 0.030%), Haitian (6.1%, a difference of 0.070%), Trinidadian and Tobagonian (6.1%, a difference of 0.080%), and Immigrants from Caribbean (6.1%, a difference of 0.14%).
| Demographics | Rating | Rank | Female Unemployment |
| Armenians | 0.0 /100 | #279 | Tragic 6.0% |
| Mexican American Indians | 0.0 /100 | #280 | Tragic 6.0% |
| Guatemalans | 0.0 /100 | #281 | Tragic 6.0% |
| Colville | 0.0 /100 | #282 | Tragic 6.0% |
| Salvadorans | 0.0 /100 | #283 | Tragic 6.0% |
| Immigrants | Senegal | 0.0 /100 | #284 | Tragic 6.1% |
| Immigrants | Cabo Verde | 0.0 /100 | #285 | Tragic 6.1% |
| Chippewa | 0.0 /100 | #286 | Tragic 6.1% |
| Immigrants | Guatemala | 0.0 /100 | #287 | Tragic 6.1% |
| Haitians | 0.0 /100 | #288 | Tragic 6.1% |
| Trinidadians and Tobagonians | 0.0 /100 | #289 | Tragic 6.1% |
| Immigrants | Caribbean | 0.0 /100 | #290 | Tragic 6.1% |
| Immigrants | West Indies | 0.0 /100 | #291 | Tragic 6.1% |
| Immigrants | Trinidad and Tobago | 0.0 /100 | #292 | Tragic 6.1% |
| Mexicans | 0.0 /100 | #293 | Tragic 6.1% |