Immigrants from North America vs Mexican Disability Age Over 75
COMPARE
Immigrants from North America
Mexican
Disability Age Over 75
Disability Age Over 75 Comparison
Immigrants from North America
Mexicans
45.7%
DISABILITY AGE OVER 75
99.8/ 100
METRIC RATING
49th/ 347
METRIC RANK
51.1%
DISABILITY AGE OVER 75
0.0/ 100
METRIC RATING
315th/ 347
METRIC RANK
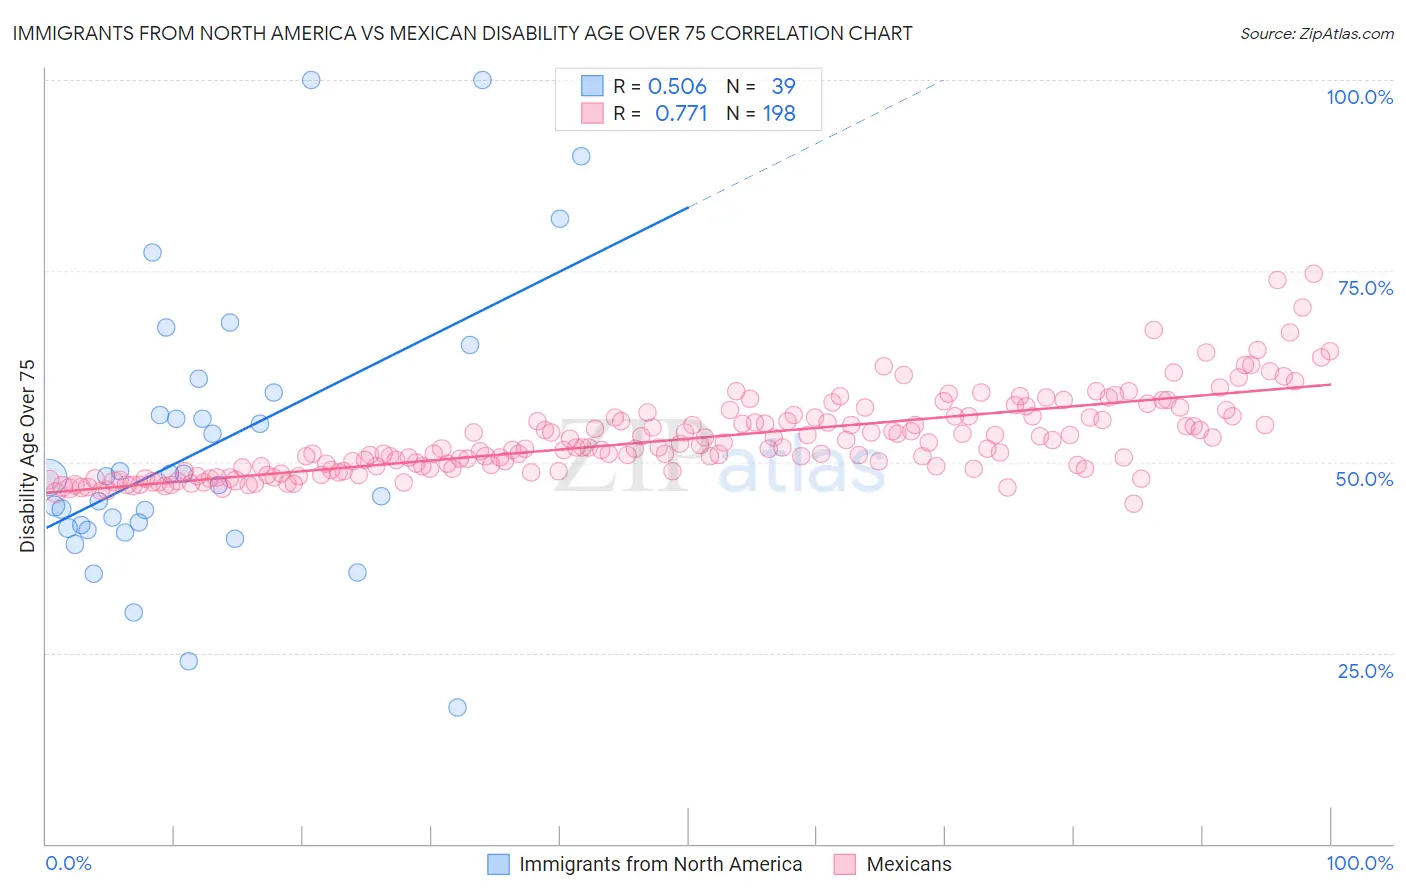
Immigrants from North America vs Mexican Disability Age Over 75 Correlation Chart
The statistical analysis conducted on geographies consisting of 461,705,283 people shows a substantial positive correlation between the proportion of Immigrants from North America and percentage of population with a disability over the age of 75 in the United States with a correlation coefficient (R) of 0.506 and weighted average of 45.7%. Similarly, the statistical analysis conducted on geographies consisting of 562,773,685 people shows a strong positive correlation between the proportion of Mexicans and percentage of population with a disability over the age of 75 in the United States with a correlation coefficient (R) of 0.771 and weighted average of 51.1%, a difference of 11.8%.
Disability Age Over 75 Correlation Summary
| Measurement | Immigrants from North America | Mexican |
| Minimum | 17.9% | 44.5% |
| Maximum | 100.0% | 74.6% |
| Range | 82.1% | 30.1% |
| Mean | 52.0% | 53.0% |
| Median | 48.0% | 51.7% |
| Interquartile 25% (IQ1) | 41.4% | 48.9% |
| Interquartile 75% (IQ3) | 59.1% | 55.9% |
| Interquartile Range (IQR) | 17.8% | 6.9% |
| Standard Deviation (Sample) | 18.3% | 5.3% |
| Standard Deviation (Population) | 18.1% | 5.3% |
Similar Demographics by Disability Age Over 75
Demographics Similar to Immigrants from North America by Disability Age Over 75
In terms of disability age over 75, the demographic groups most similar to Immigrants from North America are Immigrants from Canada (45.7%, a difference of 0.070%), Croatian (45.7%, a difference of 0.070%), Swedish (45.7%, a difference of 0.090%), Australian (45.7%, a difference of 0.12%), and Turkish (45.7%, a difference of 0.12%).
| Demographics | Rating | Rank | Disability Age Over 75 |
| Greeks | 99.8 /100 | #42 | Exceptional 45.6% |
| Czechs | 99.8 /100 | #43 | Exceptional 45.7% |
| Australians | 99.8 /100 | #44 | Exceptional 45.7% |
| Turks | 99.8 /100 | #45 | Exceptional 45.7% |
| Swedes | 99.8 /100 | #46 | Exceptional 45.7% |
| Immigrants | Canada | 99.8 /100 | #47 | Exceptional 45.7% |
| Croatians | 99.8 /100 | #48 | Exceptional 45.7% |
| Immigrants | North America | 99.8 /100 | #49 | Exceptional 45.7% |
| Belgians | 99.7 /100 | #50 | Exceptional 45.8% |
| Immigrants | Korea | 99.7 /100 | #51 | Exceptional 45.8% |
| Immigrants | France | 99.7 /100 | #52 | Exceptional 45.8% |
| Immigrants | Italy | 99.7 /100 | #53 | Exceptional 45.8% |
| Slovaks | 99.6 /100 | #54 | Exceptional 45.8% |
| Maltese | 99.6 /100 | #55 | Exceptional 45.8% |
| Immigrants | Netherlands | 99.6 /100 | #56 | Exceptional 45.9% |
Demographics Similar to Mexicans by Disability Age Over 75
In terms of disability age over 75, the demographic groups most similar to Mexicans are Immigrants from Mexico (51.1%, a difference of 0.050%), Chickasaw (51.2%, a difference of 0.14%), Yakama (51.3%, a difference of 0.32%), Immigrants from the Azores (50.9%, a difference of 0.42%), and Cheyenne (50.9%, a difference of 0.47%).
| Demographics | Rating | Rank | Disability Age Over 75 |
| Hispanics or Latinos | 0.0 /100 | #308 | Tragic 50.6% |
| Aleuts | 0.0 /100 | #309 | Tragic 50.6% |
| Tlingit-Haida | 0.0 /100 | #310 | Tragic 50.6% |
| Cajuns | 0.0 /100 | #311 | Tragic 50.7% |
| Cheyenne | 0.0 /100 | #312 | Tragic 50.9% |
| Immigrants | Azores | 0.0 /100 | #313 | Tragic 50.9% |
| Immigrants | Mexico | 0.0 /100 | #314 | Tragic 51.1% |
| Mexicans | 0.0 /100 | #315 | Tragic 51.1% |
| Chickasaw | 0.0 /100 | #316 | Tragic 51.2% |
| Yakama | 0.0 /100 | #317 | Tragic 51.3% |
| Seminole | 0.0 /100 | #318 | Tragic 51.5% |
| Creek | 0.0 /100 | #319 | Tragic 51.5% |
| Paiute | 0.0 /100 | #320 | Tragic 51.5% |
| Dutch West Indians | 0.0 /100 | #321 | Tragic 51.5% |
| Comanche | 0.0 /100 | #322 | Tragic 51.7% |