Immigrants from Nigeria vs Colville Female Poverty
COMPARE
Immigrants from Nigeria
Colville
Female Poverty
Female Poverty Comparison
Immigrants from Nigeria
Colville
14.7%
FEMALE POVERTY
2.1/ 100
METRIC RATING
227th/ 347
METRIC RANK
17.8%
FEMALE POVERTY
0.0/ 100
METRIC RATING
325th/ 347
METRIC RANK
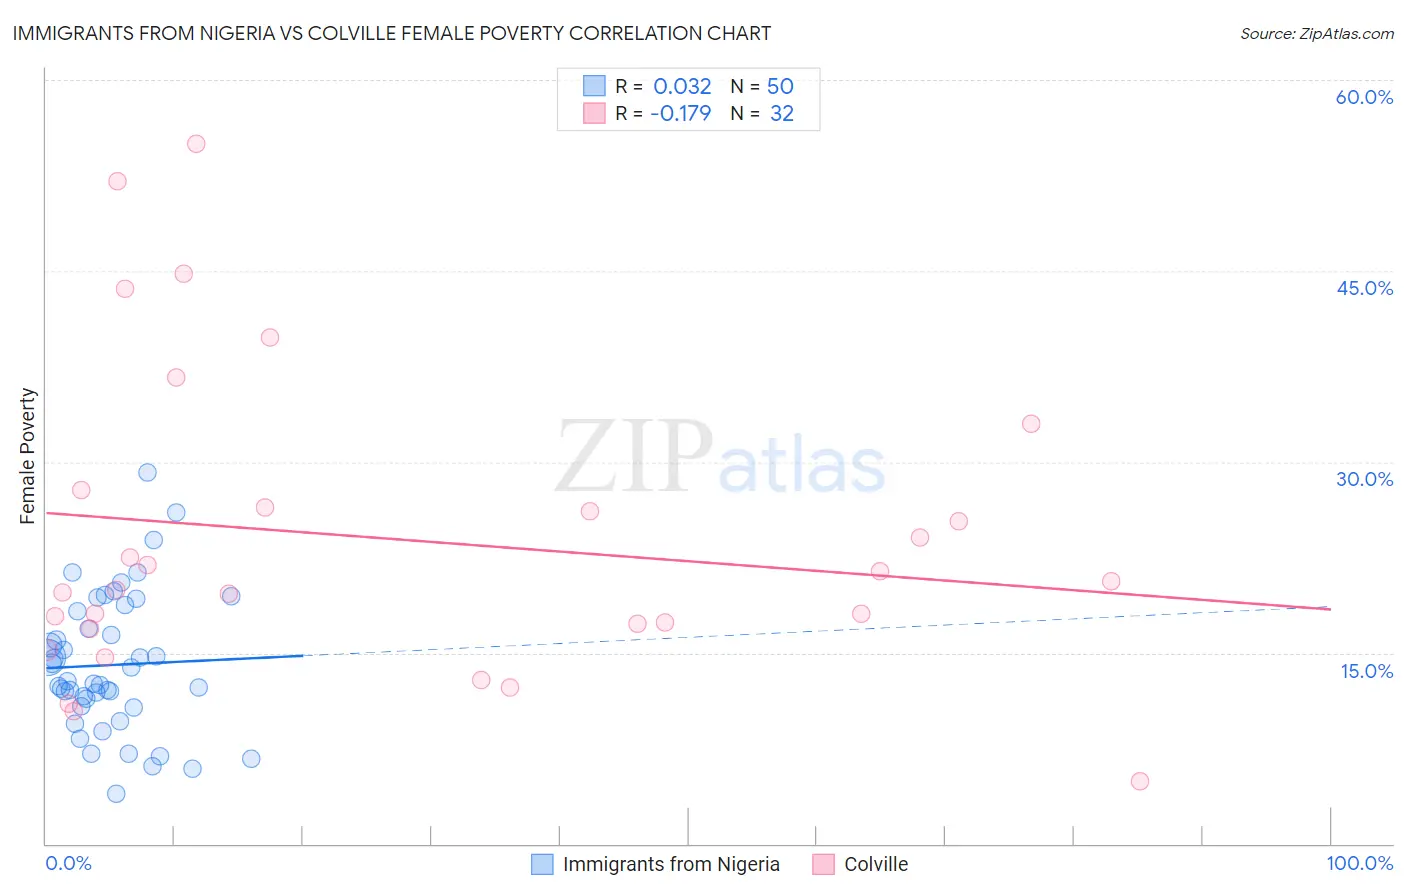
Immigrants from Nigeria vs Colville Female Poverty Correlation Chart
The statistical analysis conducted on geographies consisting of 283,264,818 people shows no correlation between the proportion of Immigrants from Nigeria and poverty level among females in the United States with a correlation coefficient (R) of 0.032 and weighted average of 14.7%. Similarly, the statistical analysis conducted on geographies consisting of 34,683,494 people shows a poor negative correlation between the proportion of Colville and poverty level among females in the United States with a correlation coefficient (R) of -0.179 and weighted average of 17.8%, a difference of 20.9%.
Female Poverty Correlation Summary
| Measurement | Immigrants from Nigeria | Colville |
| Minimum | 3.9% | 4.9% |
| Maximum | 29.1% | 55.0% |
| Range | 25.2% | 50.1% |
| Mean | 14.0% | 24.0% |
| Median | 12.7% | 20.3% |
| Interquartile 25% (IQ1) | 10.8% | 17.1% |
| Interquartile 75% (IQ3) | 18.2% | 27.1% |
| Interquartile Range (IQR) | 7.4% | 10.0% |
| Standard Deviation (Sample) | 5.4% | 12.1% |
| Standard Deviation (Population) | 5.4% | 11.9% |
Similar Demographics by Female Poverty
Demographics Similar to Immigrants from Nigeria by Female Poverty
In terms of female poverty, the demographic groups most similar to Immigrants from Nigeria are German Russian (14.7%, a difference of 0.15%), Ghanaian (14.7%, a difference of 0.21%), Immigrants from Eritrea (14.6%, a difference of 0.31%), Alaska Native (14.7%, a difference of 0.41%), and Nigerian (14.8%, a difference of 0.51%).
| Demographics | Rating | Rank | Female Poverty |
| Alsatians | 4.0 /100 | #220 | Tragic 14.5% |
| Immigrants | Cambodia | 3.7 /100 | #221 | Tragic 14.5% |
| Immigrants | Nonimmigrants | 3.7 /100 | #222 | Tragic 14.5% |
| Immigrants | Africa | 3.3 /100 | #223 | Tragic 14.5% |
| Americans | 2.8 /100 | #224 | Tragic 14.6% |
| Immigrants | Micronesia | 2.8 /100 | #225 | Tragic 14.6% |
| Immigrants | Eritrea | 2.4 /100 | #226 | Tragic 14.6% |
| Immigrants | Nigeria | 2.1 /100 | #227 | Tragic 14.7% |
| German Russians | 2.0 /100 | #228 | Tragic 14.7% |
| Ghanaians | 1.9 /100 | #229 | Tragic 14.7% |
| Alaska Natives | 1.8 /100 | #230 | Tragic 14.7% |
| Nigerians | 1.7 /100 | #231 | Tragic 14.8% |
| Osage | 1.5 /100 | #232 | Tragic 14.8% |
| Immigrants | Saudi Arabia | 1.4 /100 | #233 | Tragic 14.8% |
| Fijians | 1.1 /100 | #234 | Tragic 14.9% |
Demographics Similar to Colville by Female Poverty
In terms of female poverty, the demographic groups most similar to Colville are Immigrants from Honduras (17.7%, a difference of 0.15%), Paiute (17.7%, a difference of 0.34%), Menominee (17.6%, a difference of 0.93%), Central American Indian (18.0%, a difference of 1.5%), and Arapaho (17.5%, a difference of 1.6%).
| Demographics | Rating | Rank | Female Poverty |
| Ute | 0.0 /100 | #318 | Tragic 17.5% |
| Cajuns | 0.0 /100 | #319 | Tragic 17.5% |
| Immigrants | Dominica | 0.0 /100 | #320 | Tragic 17.5% |
| Arapaho | 0.0 /100 | #321 | Tragic 17.5% |
| Menominee | 0.0 /100 | #322 | Tragic 17.6% |
| Paiute | 0.0 /100 | #323 | Tragic 17.7% |
| Immigrants | Honduras | 0.0 /100 | #324 | Tragic 17.7% |
| Colville | 0.0 /100 | #325 | Tragic 17.8% |
| Central American Indians | 0.0 /100 | #326 | Tragic 18.0% |
| Yakama | 0.0 /100 | #327 | Tragic 18.0% |
| Blacks/African Americans | 0.0 /100 | #328 | Tragic 18.6% |
| Kiowa | 0.0 /100 | #329 | Tragic 18.6% |
| Dominicans | 0.0 /100 | #330 | Tragic 19.1% |
| Natives/Alaskans | 0.0 /100 | #331 | Tragic 19.2% |
| Apache | 0.0 /100 | #332 | Tragic 19.2% |