Immigrants from Nigeria vs Croatian Female Poverty
COMPARE
Immigrants from Nigeria
Croatian
Female Poverty
Female Poverty Comparison
Immigrants from Nigeria
Croatians
14.7%
FEMALE POVERTY
2.1/ 100
METRIC RATING
227th/ 347
METRIC RANK
11.6%
FEMALE POVERTY
99.6/ 100
METRIC RATING
26th/ 347
METRIC RANK
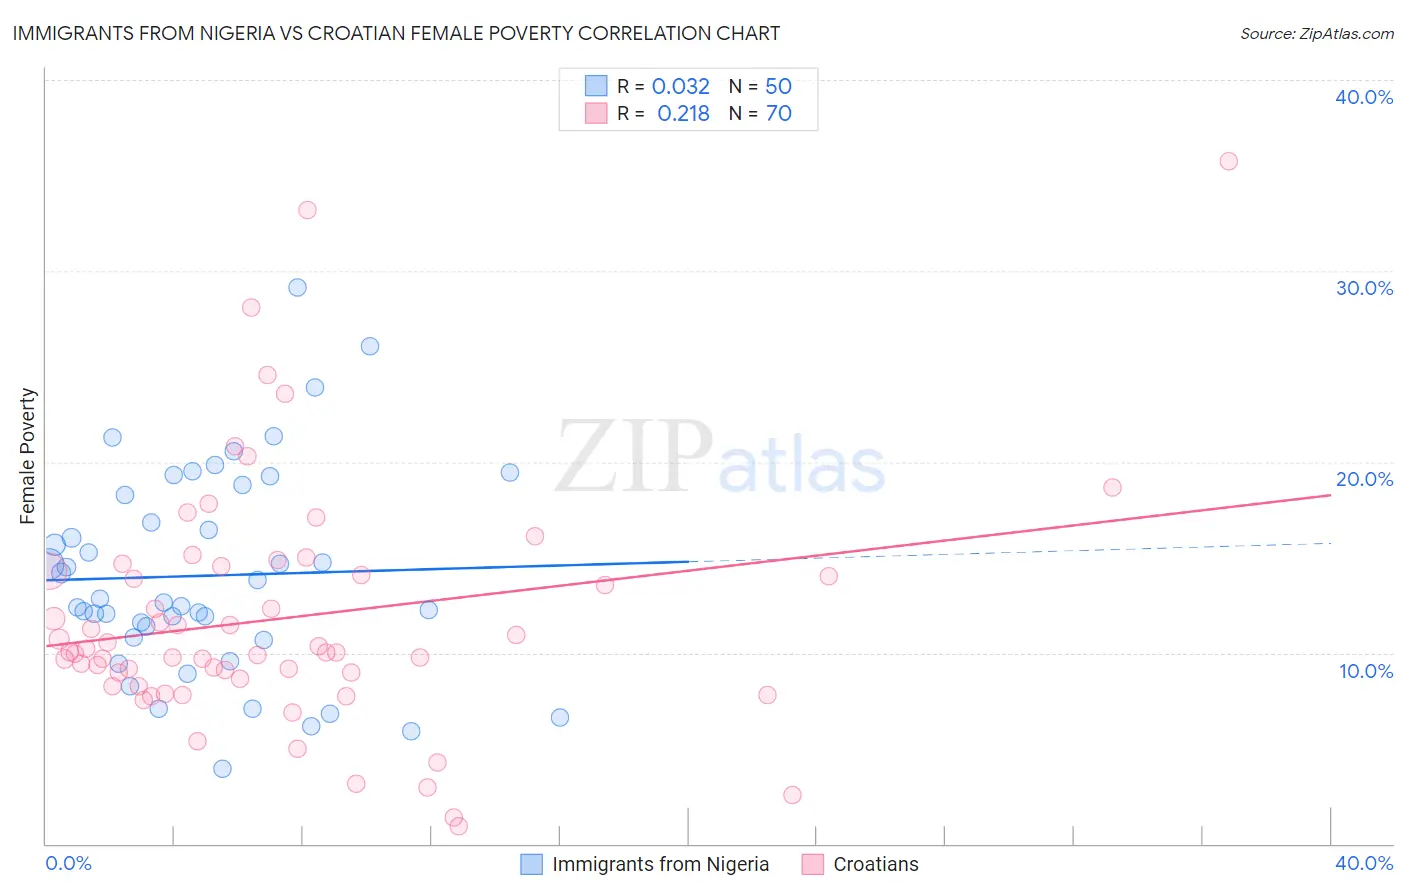
Immigrants from Nigeria vs Croatian Female Poverty Correlation Chart
The statistical analysis conducted on geographies consisting of 283,264,818 people shows no correlation between the proportion of Immigrants from Nigeria and poverty level among females in the United States with a correlation coefficient (R) of 0.032 and weighted average of 14.7%. Similarly, the statistical analysis conducted on geographies consisting of 375,484,978 people shows a weak positive correlation between the proportion of Croatians and poverty level among females in the United States with a correlation coefficient (R) of 0.218 and weighted average of 11.6%, a difference of 26.1%.
Female Poverty Correlation Summary
| Measurement | Immigrants from Nigeria | Croatian |
| Minimum | 3.9% | 0.92% |
| Maximum | 29.1% | 35.7% |
| Range | 25.2% | 34.8% |
| Mean | 14.0% | 11.8% |
| Median | 12.7% | 10.0% |
| Interquartile 25% (IQ1) | 10.8% | 8.6% |
| Interquartile 75% (IQ3) | 18.2% | 14.2% |
| Interquartile Range (IQR) | 7.4% | 5.6% |
| Standard Deviation (Sample) | 5.4% | 6.4% |
| Standard Deviation (Population) | 5.4% | 6.4% |
Similar Demographics by Female Poverty
Demographics Similar to Immigrants from Nigeria by Female Poverty
In terms of female poverty, the demographic groups most similar to Immigrants from Nigeria are German Russian (14.7%, a difference of 0.15%), Ghanaian (14.7%, a difference of 0.21%), Immigrants from Eritrea (14.6%, a difference of 0.31%), Alaska Native (14.7%, a difference of 0.41%), and Nigerian (14.8%, a difference of 0.51%).
| Demographics | Rating | Rank | Female Poverty |
| Alsatians | 4.0 /100 | #220 | Tragic 14.5% |
| Immigrants | Cambodia | 3.7 /100 | #221 | Tragic 14.5% |
| Immigrants | Nonimmigrants | 3.7 /100 | #222 | Tragic 14.5% |
| Immigrants | Africa | 3.3 /100 | #223 | Tragic 14.5% |
| Americans | 2.8 /100 | #224 | Tragic 14.6% |
| Immigrants | Micronesia | 2.8 /100 | #225 | Tragic 14.6% |
| Immigrants | Eritrea | 2.4 /100 | #226 | Tragic 14.6% |
| Immigrants | Nigeria | 2.1 /100 | #227 | Tragic 14.7% |
| German Russians | 2.0 /100 | #228 | Tragic 14.7% |
| Ghanaians | 1.9 /100 | #229 | Tragic 14.7% |
| Alaska Natives | 1.8 /100 | #230 | Tragic 14.7% |
| Nigerians | 1.7 /100 | #231 | Tragic 14.8% |
| Osage | 1.5 /100 | #232 | Tragic 14.8% |
| Immigrants | Saudi Arabia | 1.4 /100 | #233 | Tragic 14.8% |
| Fijians | 1.1 /100 | #234 | Tragic 14.9% |
Demographics Similar to Croatians by Female Poverty
In terms of female poverty, the demographic groups most similar to Croatians are Immigrants from Northern Europe (11.6%, a difference of 0.0%), Iranian (11.7%, a difference of 0.11%), Luxembourger (11.6%, a difference of 0.27%), Burmese (11.6%, a difference of 0.29%), and Immigrants from Korea (11.7%, a difference of 0.32%).
| Demographics | Rating | Rank | Female Poverty |
| Norwegians | 99.8 /100 | #19 | Exceptional 11.5% |
| Eastern Europeans | 99.7 /100 | #20 | Exceptional 11.5% |
| Italians | 99.7 /100 | #21 | Exceptional 11.6% |
| Swedes | 99.7 /100 | #22 | Exceptional 11.6% |
| Burmese | 99.7 /100 | #23 | Exceptional 11.6% |
| Luxembourgers | 99.7 /100 | #24 | Exceptional 11.6% |
| Immigrants | Northern Europe | 99.6 /100 | #25 | Exceptional 11.6% |
| Croatians | 99.6 /100 | #26 | Exceptional 11.6% |
| Iranians | 99.6 /100 | #27 | Exceptional 11.7% |
| Immigrants | Korea | 99.6 /100 | #28 | Exceptional 11.7% |
| Immigrants | North Macedonia | 99.6 /100 | #29 | Exceptional 11.7% |
| Greeks | 99.5 /100 | #30 | Exceptional 11.7% |
| Poles | 99.5 /100 | #31 | Exceptional 11.7% |
| Danes | 99.5 /100 | #32 | Exceptional 11.7% |
| Cypriots | 99.5 /100 | #33 | Exceptional 11.8% |